Display
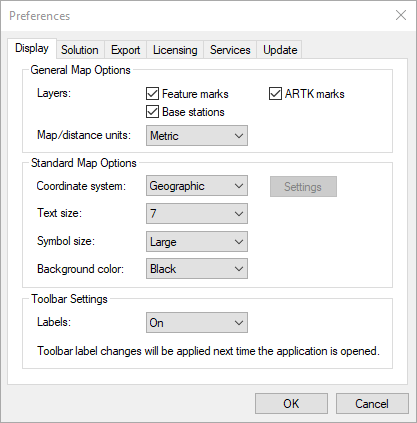
This tab allows you to edit what is displayed on the Map window. Disabling features or base stations from here will only prevent them from being displayed to the Map window and will not remove them from the project.
General Map Options
The following settings are available for the Standard Map and Satellite Map:
Feature marks
This option controls whether time-stamped events, such as camera marks, features or stations appear on the Map window. Users may wish to disable the display of feature marks if they are continually collected throughout the survey, resulting in hundreds or thousands being decoded. If this is the case, the feature marks will make it difficult to see the processed quality numbers on the Map window which can be useful in QC.
ARTK marks
ARTK marks indicate where fixed integers have been resolved. Users may or may not want to include these in the Map window display if printing generated HTML reports.
Base stations
When disabling the display of base stations, the Map window automatically zooms to the extents of the project area covered by the remote GNSS antenna. This can be useful for the QC of multi-base or large scale projects.
Centroid circle (Inertial Explorer Xpress only)
The circle encompassing a 3 km radius around the project centroid will be drawn on the Map window if this feature is enabled. Only GNSS+INS processed points within this radius may be exported.
The centroid is an average of all non-stationary processed coordinates in the project.
Map/distance units
Changes the units of the values being displayed for local level or grid coordinates in the Map window.
Standard Map Options
The following settings are available for the Standard Map only:
Coordinate system
Select the coordinate system used on the Map window.
Geographic – Displays the latitude and longitude on the screen. The orientation is such that the positive y-axis is true north.
Grid – Displays the coordinates in the grid selected. By default, the grid applied will be the UTM zone which has been auto-detected from the remote GNSS data.
Several international and regional grids are supported, such as UTM, US State Plane, British Grid, Irish Grid etc. To change the grid, click the Settings button to open the Grid Settings for Coordinate Input dialog and select the grid from the Grid option.
Custom grids can also be defined by selecting Define Grids within the Grid Settings for Coordinate Input dialog.
Defining a grid allows the grid to be accessed by the Export Wizard. Base station coordinates can also be added directly in grid format as well.
Grid information is stored in the project. Set up a grid for the following reasons:
-
Master coordinates can be entered directly in a supported grid.
-
The Map window can plot in grid coordinates. See Show Map Window for more details.
-
Export Wizard can use a defined grid for coordinate output. See Export Wizard for details.
New grid definitions can be added by clicking Define Grid or via Tools | Grid/Map Projections | Define. See Grid/Map Projection for more information.
Local level – Plots the local level vector if moving baseline processing has been performed. Moving baseline processing should only be engaged if both base and rover are kinematic and the relative vector between them is of interest. Moving baseline processing does not produce accurate absolute positioning results, only accurate relative positioning results.
The Local level option can only be enabled when using GrafNav and is only available if moving baseline processing has been enabled.
Text size
Controls the font size.
Symbol size
Controls the display of symbols, including processed epochs, ARTK indicators, feature marks and base stations.
Background color
Changes the background color of the Map window to black or white. A white background may be preferred when printing generated HTML reports.
Toolbar Settings
Labels
Controls whether text descriptions are shown on Waypoint toolbar.