Network Adjustment
GrafNet contains a least-squares network adjustment that can be accessed through Process | Network Adjustment. External network adjustment programs, such as StarNet, also support GrafNet's output format.
Network adjustments are a means to more accurately compute each station’s coordinates given the solution vectors computed for each session / baseline. Such an adjustment uses the X, Y and Z vector components and also utilizes the 3 x 3 covariance matrix which is the standard deviation values + coordinate-to-coordinate correlation. Using least squares, the errors are distributed based on a session’s estimated accuracy. More weight is placed on sessions with lower standard deviations.
Advantages
In the traverse solution, each station’s coordinates are determined using one session from one previous station. For networks with redundant measurements, which is usually the case, this will lead to sub-optimal determination of a station’s coordinates. The network adjustment does a much better job of distributing errors. This makes it less sensitive to errors as long as a session’s estimated accuracy is representative of actual errors. Thus, the network adjustment always produces the best station coordinates.
Another advantage of the network adjustment over the traverse solution is that it computes a standard deviation for each station coordinate, which is not possible in a traverse solution.
Before running the network adjustment, all baselines must have already been processed. Only good (green) baselines will be used, unless otherwise specified with the Utilize sessions labeled ‘BAD’ in network adjustment option.
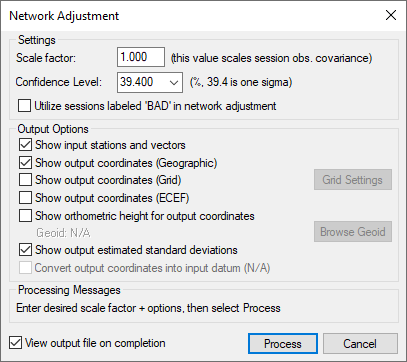
Settings
Scale Factor
Error ellipses should appear on the stations in the Map Window. These ellipses are scaled by this option.
Confidence Level
The level of confidence (in percent) of the error ellipse can also be adjusted. This uses a statistical 2-D normal distribution. Changing this value does not alter the final coordinates, but it will scale the final standard deviations and covariance values. For example, 95% results in a standard deviation scale factor of 2.44.
Output Options
Controls what is output from the network solution.
Show input stations and vectors
Outputs all the control and check points and their vectors. The coordinates are output in geographic form.
Show orthometric height for output coordinates
Requires that you provide a geoid file, which can be selected with the Browse Geoid button.
Other output options include outputting the estimated standard deviations.
To process the network adjustment, click the Process button. This step must be performed each time a project is re-loaded.
Show output coordinates
Output coordinates may be shown in Geographic (latitutde/longitude/ellipsoidal height), Grid and/or ECEF coordinates.
View output file on completion
Lets you view the ASCII solution file once the adjustment has been made.
Refer to the following links for more information about network adjustments:
How to Process with the Network Adjustment
Interpreting the network adjustment report