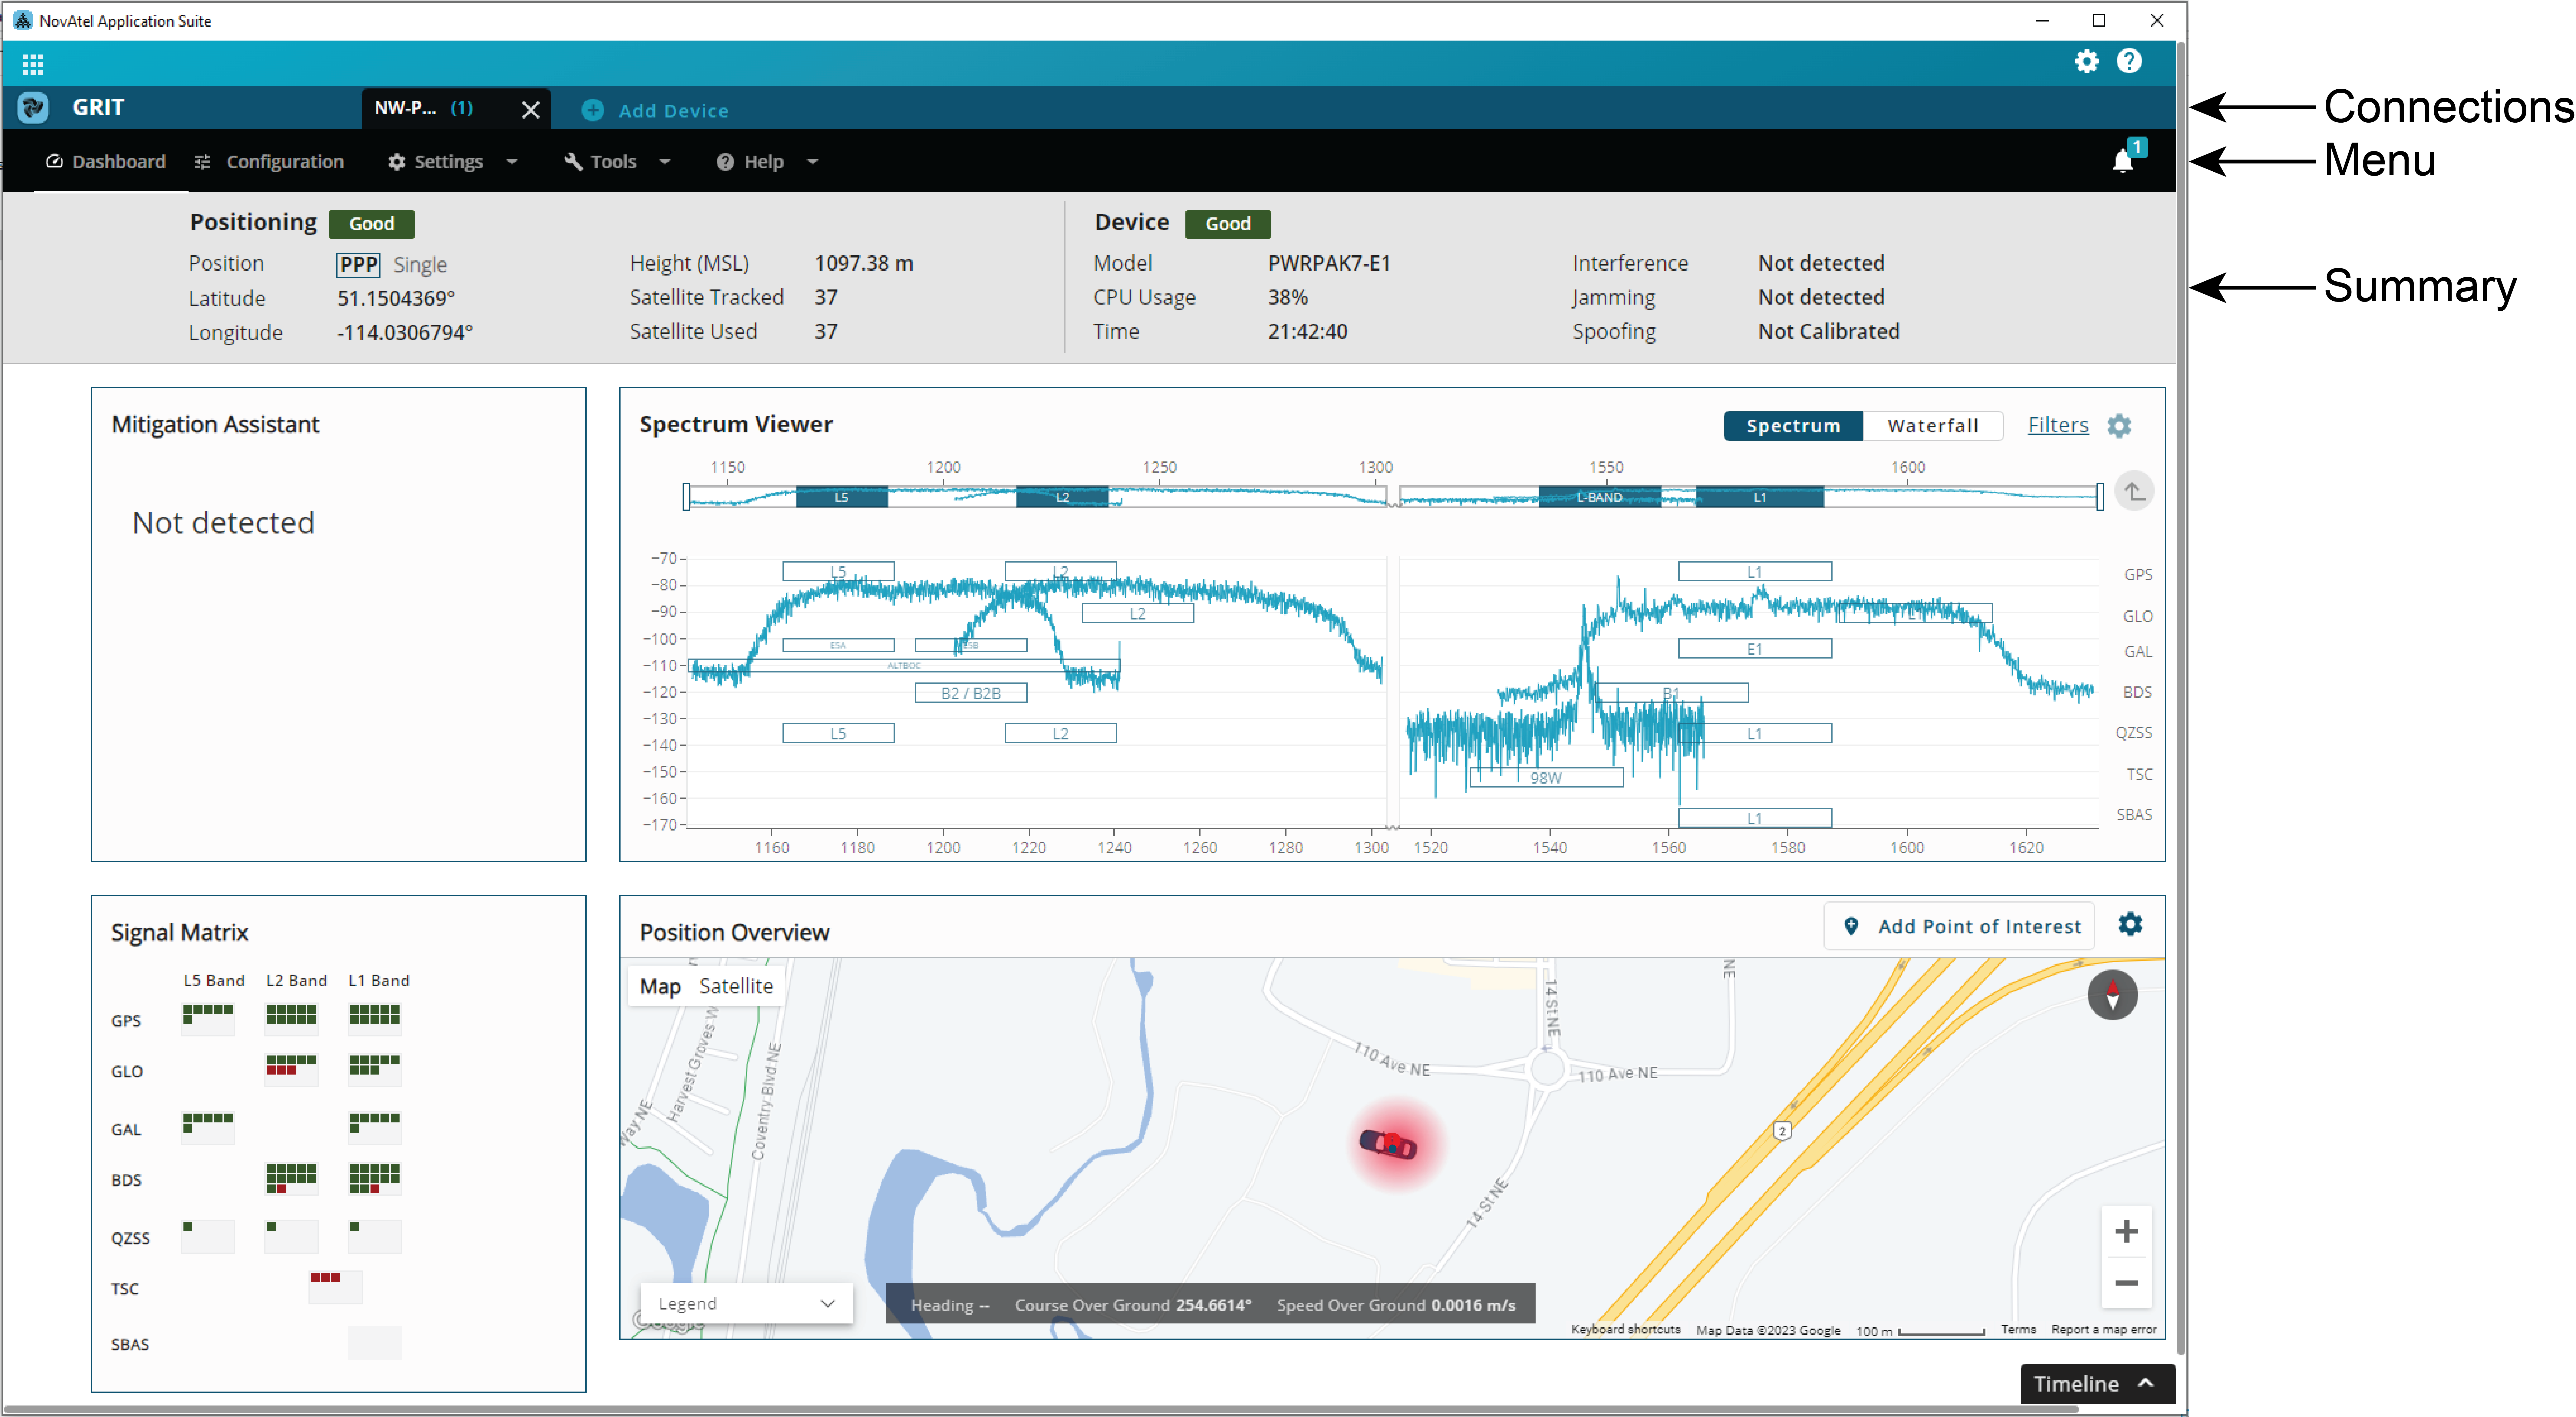
GRIT Monitor Dashboard
When a connection to a receiver is opened, the GRIT Dashboard is displayed. From this window, all of the GRIT features for the receiver can be accessed.

Connections Bar
The Connections bar appears at the top of all GRIT Monitor windows. This bar shows all the Devices to which the computer currently has a connection.
The Device that is currently being viewed is black. To view a different Device, click the tab on the Connections bar for that Device.
To close a connection, click the X button on the Device tab.
To add a new Device, click the + button on the Connections bar. The New Connection dialog box appears.
Menu Bar
The Menu bar provides access to other tools and settings available in GRIT Monitor. For information about the Menu, see Menu.
From the Event menu option (![]() ), you can view the events (warnings, errors or status messages) that apply to the receiver. The number beside the Event menu indicates the current number of events on the receiver. For information about the Events menu, see Events.
), you can view the events (warnings, errors or status messages) that apply to the receiver. The number beside the Event menu indicates the current number of events on the receiver. For information about the Events menu, see Events.
Summary Bar
The Summary bar provides status information about the receiver.

Status Indicator
A colored bar with text indicates the status of the summary information shown.
|
Color |
Text |
Description |
|---|---|---|
|
Green |
Good |
The receiver is functioning and there are no warnings or errors. |
|
Amber |
Warning |
The receiver is functioning, but there are one or more issues that may require attention. |
|
Red |
Error |
An issue is preventing the receiver from functioning. The Error state will remain until the situation is resolved. |
If the receiver has a warning or error, click the status indicator to open a tooltip with more information about the warning or error. You can also check the status boxes on the Status tab in Manage. An amber or red status indicator appears on the status box where more information about the warning or error can be found. See Status Window for more information.
Position
The Position field shows all of the positioning types configured on the receiver. The positioning type that is currently being used to calculate the position is highlighted in a box.
Latitude
The Latitude field shows the latitude of the calculated position in degrees.
Longitude
The Longitude field shows the longitude of the calculated position in degrees.
Height (MSL)
The Height (MSL) field shows the height above mean sea level of the calculated position in metres.
Satellite Tracked
The Satellite Tracked field shows the number of satellites the receiver is currently tracking.
Satellite Used
The Satellite Used field shows the number of satellites used in the current position mode.
Model
The Model field shows the receiver type.
CPU Usage
The CPU Usage field shows the amount of receiver computing (CPU) power currently being used.
Time
The Time field shows the current UTC time.
Interference
The Interference field indicates if the receiver has detected interference in the GNSS signal.
Jamming
The Jamming field indicates if the receiver has detected jamming in the GNSS signal.
Spoofing
The Spoofing field indicates if the receiver has detected spoofing in the GNSS signal. The receiver must be calibrated before it can reliably detect spoofing.
Timeline Bar
GRIT Monitor keeps a 10 minute running history of GRIT Monitor information. This history can be accessed from the Timeline bar.
To view GRIT Monitor information from the past 10 minutes:
Click the Timeline button to open the Timeline bar.
Click the location of interest on the Timeline bar.
GRIT Monitor switches to show the information from the time selected.
The time selected is shown in the middle of the Timeline bar beside the play back controls. The current time is shown on the right side of the Timeline bar.
Use the Timeline bar controls to move within the 10 minute window. The GRIT Monitor dashboard screens show the data for the selected time.
The Timeline bar continues to update with new information received by the receiver so that the Timeline always shows the last 10 minutes of information. New information is added on the right side of the bar and information older than 10 minutes moves off of the left side of the bar.
When Timeline is set to play and GRIT Monitor has been open for more than 10 minutes, the time selected marker will appear to be stationary since the new information is being added as the information is being played.
When Timeline is set to play and GRIT Monitor has been open for less than 10 minutes, the time selected marker will appear to move right as new information is added.
When the Timeline is set to pause, the time selected marker will appear to move left as new information is added.
When finished viewing the information, click the RETURN TO LIVE button.
The Timeline bar can be used to record a GRIT Monitor session as a Playback file.
To record a GRIT Monitor session:
Click the Timeline button to open the Timeline bar.
Click the Record button.
Select the folder in which to save the Playback file.
GRIT Monitor begins saving the GRIT Monitor session to a file.When the desired information has been recorded, click the Stop Recording button.