Interference Toolkit
The Interference Toolkit (ITK) feature monitors, quantifies and removes interference sources to prevent interference from impacting receiver performance.
Using the Interference Toolkit, you can monitor the Radio Frequency (RF) spectrum in a range of frequencies around the GNSS signals that are being received by the OEM7 receiver. If an interference signal is detected, information about the interference is displayed on the Interference status tile. To open the Interference Toolkit window, click the Tools menu and then click Interference Toolkit.
Due to the high volume of data, a higher bandwidth medium, such as USB or Ethernet, is recommended when monitoring signals using the Interference Toolkit.
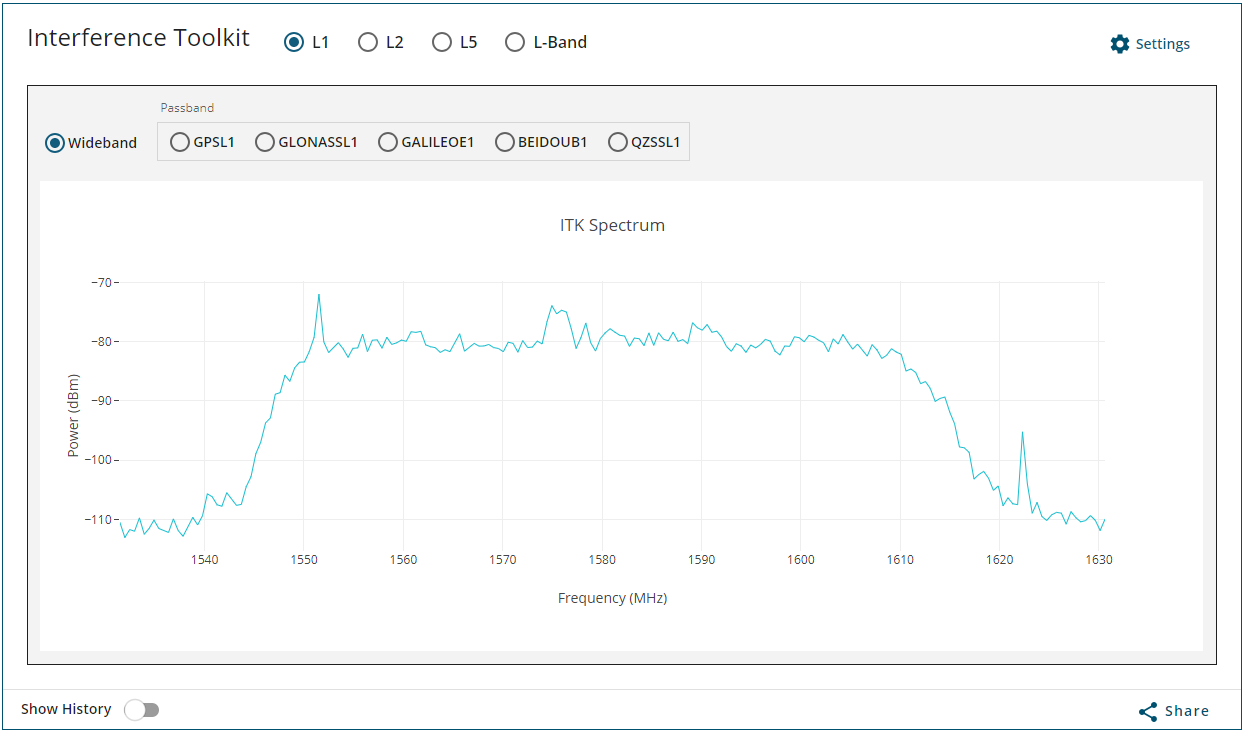
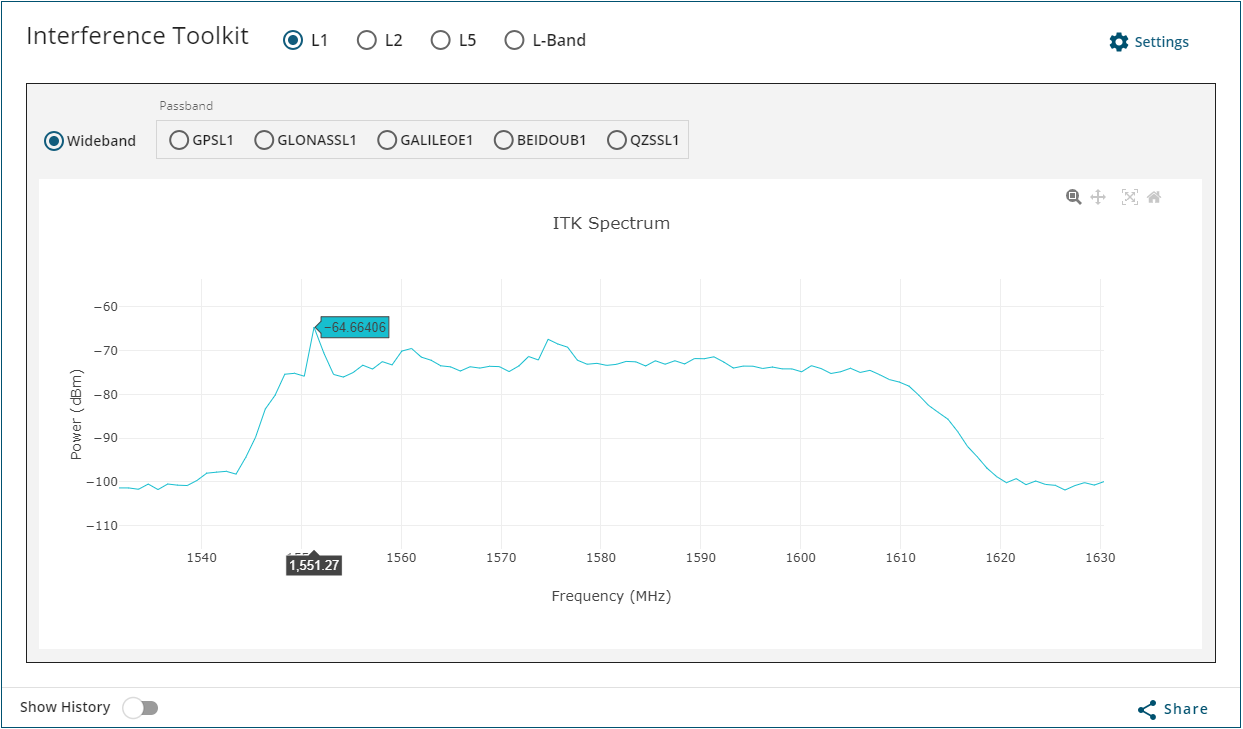
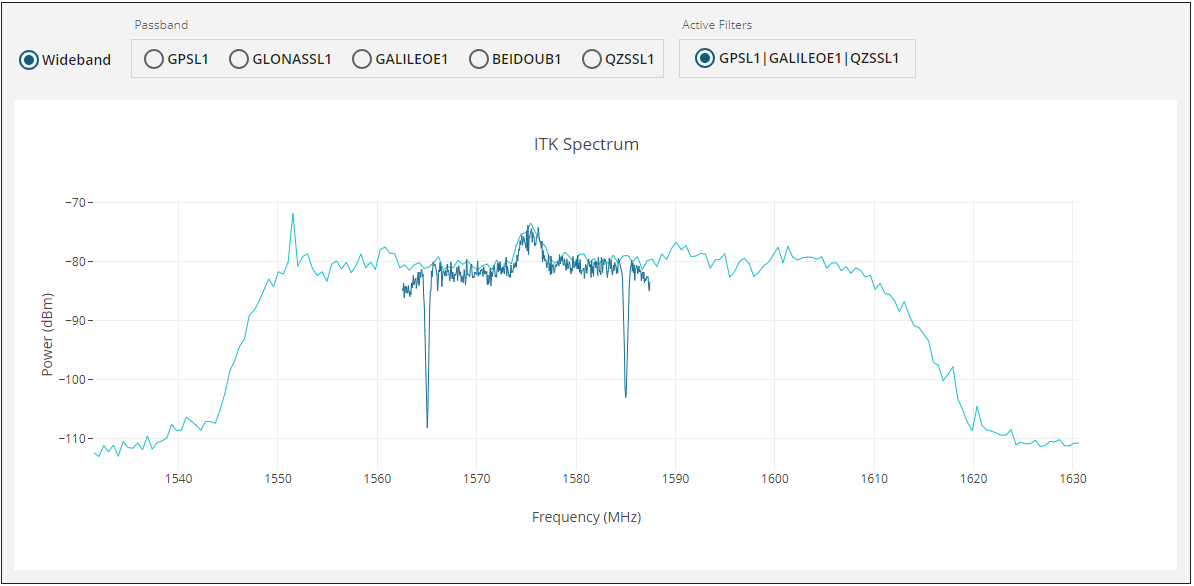
When the Interference Toolkit window is opened, a plot that shows the detected power level of all of the frequencies in the selected band is shown. This is a dynamic plot that changes based on the signal received by the receiver. If there is an interference signal in the band, it will appear as an unexpected spike in the received power level.
Change the Frequencies Viewed
When the Interference Toolkit window is opened, the window shows a plot of the wideband L1 signal. This plot shows the detected power level of all of the frequencies in the L1 band. To view the plot of a specific signal within the band, click the button for the signal in the Passband box (for example, GPSL1).
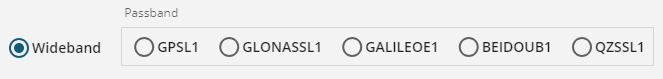
The plot changes to the set of frequencies specific to the selected signal (GPS L1 in this example).
To view of a different frequency band, click the tab for the desired band (for example, L2).
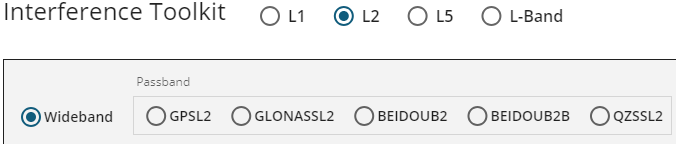
The plot changes to show the received power levels of the frequencies in the selected band (L2 in this example).
Display Options
There are several buttons on the Interference Toolkit window that change how the plot is shown.
Show History
The Show History plot shows a rolling history of the detected power levels.
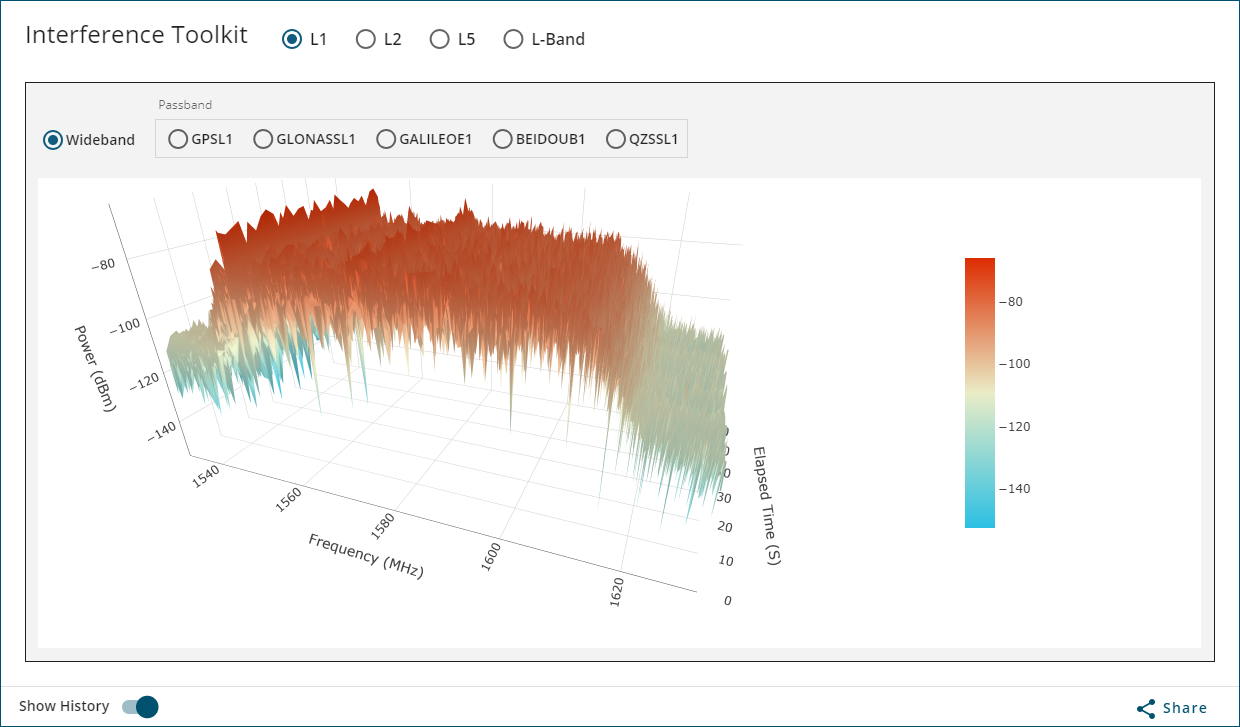
The Show History plot can be rotated by clicking and dragging the plot.
When the Show History option is on )
)
When the Show History option is off )
)
Display Buttons
When the mouse pointer is moved over the frequency plot, the power level (blue) and frequency (dark gray) of the signal at that location are shown.
As well, several buttons appear at the top of the frequency plot. The functions of these buttons are described in the following table.
|
Icon |
Name |
Available on |
Description |
|---|---|---|---|
|
|
Zoom |
Real Time Plot History Plot |
Use this button to zoom in on an area of the plot.
|
|
|
Pan |
Real Time Plot History Plot |
Use this button to move around in the plot.
|
|
|
Turntable Rotation |
History Plot |
Click the |
|
|
Reset axes |
Real Time Plot |
On the real time plot, click the |
|
Reset camera to default |
History Plot |
On the history plot, click the |

 button.


Save a Copy of the Plot
A copy of the plot currently being viewed can be saved to a file or copied to an application, such as a word processor.
To save the plot to a file:
-
Click the Share button.
-
Click Save graph as image.
-
Navigate to the folder in which the plot will be saved.
-
Enter a name in the File name box.
-
Click the Save button.
To copy the plot to another application:
-
Click the Share button.
-
Click Copy graph to clipboard.
-
Open the application, such as a word processor.
-
Paste the image.
Enable HDR Mode
The High Dynamic Range (HDR) mode enables special signal processing to remove distortions from the spectrum, providing a cleaner signal. This optimizes the Automatic Gain Control (AGC) to prevent interfering signals from drowning out the GNSS signals. HDR mode works well against wide band and out-of-band interferers. HDR mode can be combined with bandpass and notch filters, but does draw more power.
To disable HDR mode:
-
Click the Settings menu.
-
Set the Enable HDR Mode option to off
)
To enable HDR mode
-
Click the Settings menu.
-
Set the Enable HDR Mode option to on
)
Filters
If an interference signal is present, the Interference Toolkit can reduce or eliminate the impact on GNSS tracking using the programmable bandpass or notch filters.
If there are any filters active, a button for the filter is shown above signal plot.
Notch Filter
The Interference Toolkit notch filter reduces the signal power in a narrow frequency band. This type of filter is useful for reducing the signal power of a single, narrow band interference signal. Note that the narrowest possible filter should be used to maintain the maximum amount of overall signal power.
To add a notch filter:
-
Click the Settings menu.
-
Click the Add Filter link.
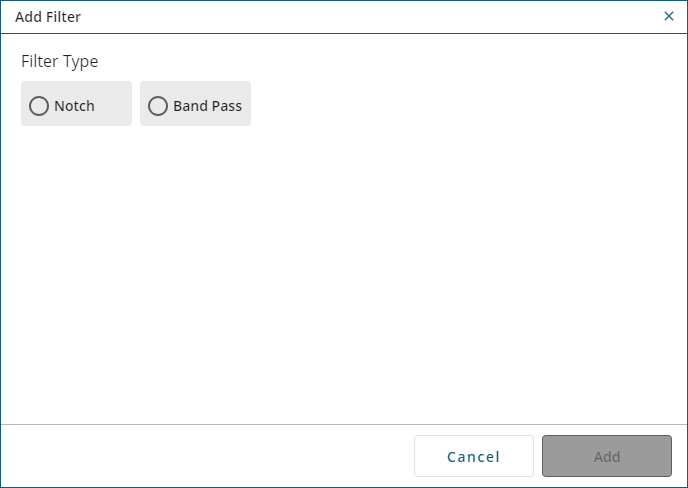
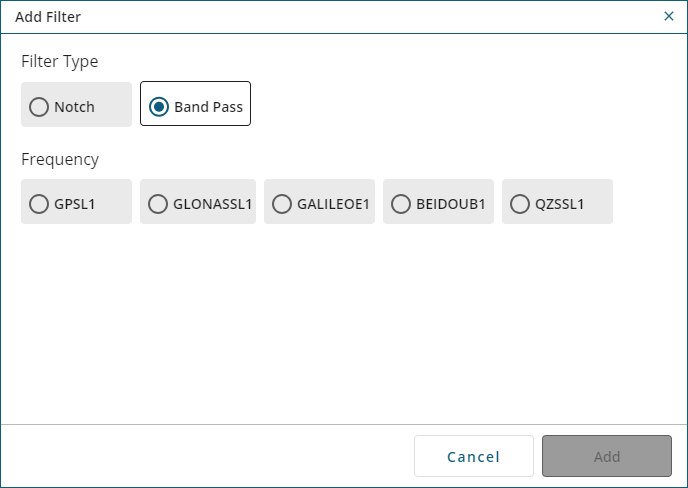
The Add Filter dialog box appears.
-
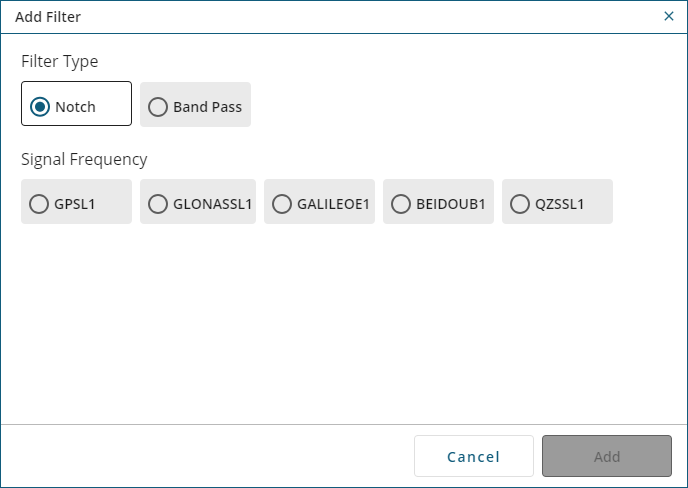
Click the Notch button.
-
Click the button for the GNSS signal to which the filter will be applied.
-
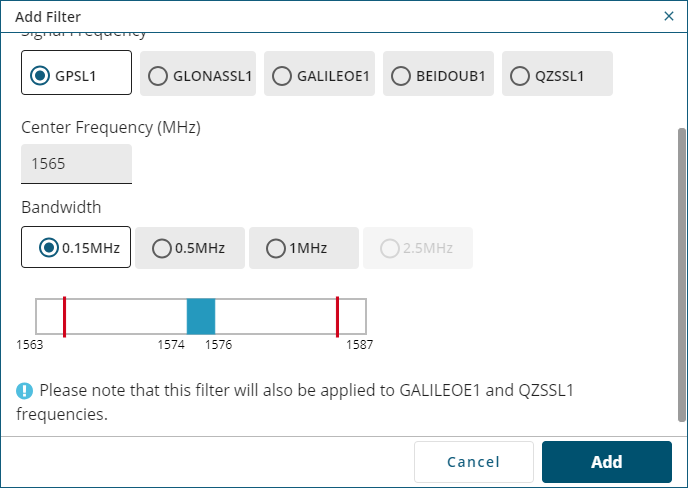
Enter the center frequency for the filter in the Center Frequency box.
-
The frequency selected must be in the range shown on the frequency bar. For the example shown above, the value must be between 1563 and 1587 MHz.
-
The selected frequency can not be within the central frequencies, represented by the blue bar. In this example, the frequency cannot be between 1574 and 1576 MHz.
-
-
Click one of the Bandwidth buttons to the select the bandwidth for the notch filter.
-
Select the narrowest bandwidth that will remove the interference signal.
-
Two notch filters are added which are equal distance from the center frequency. The configured filter is represented by red bars on the frequency bar.
-
-
Click the Add button.
A box for the new filter is added to the Settings menu, a new button for the filter is added to the Interference Toolkit window and the filtered signal is shown on the ITK Spectrum plot.
When the filter button is selected, the filtered signal is updated.
When the filter button is not selected, the unfiltered signal is updated.
Bandpass Filter
The Interference Toolkit bandpass filter reduces the signal power of all incoming signals at the upper and lower end of the GNSS signal band starting at the configured cut-off frequency. This type of filter is good for reducing single or multiple interference signals at the edges of the signal band.
When a bandpass filter is applied to the signal, the upper and lower ends of the signal band are filtered out to reduce the signal power of the interference signal.
To add a bandpass filter:
-
Click the Settings menu.
-
Click the Add Filter link.
The Add Filter dialog box appears.
-
Click the Band Pass button.
-
Click the button for the GNSS signal to which the filter will be applied.
-
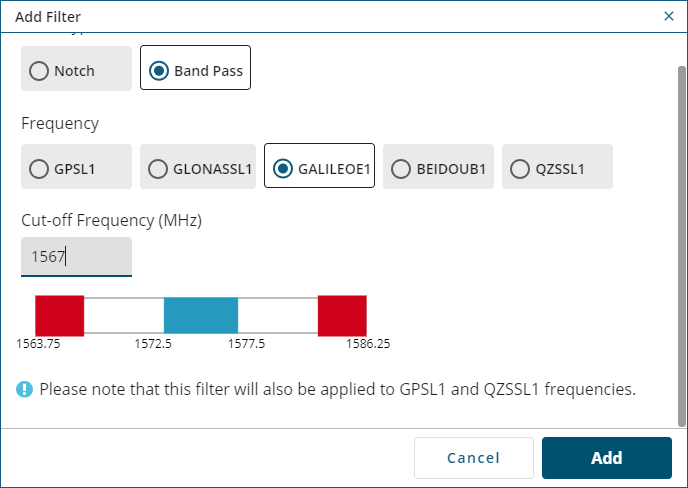
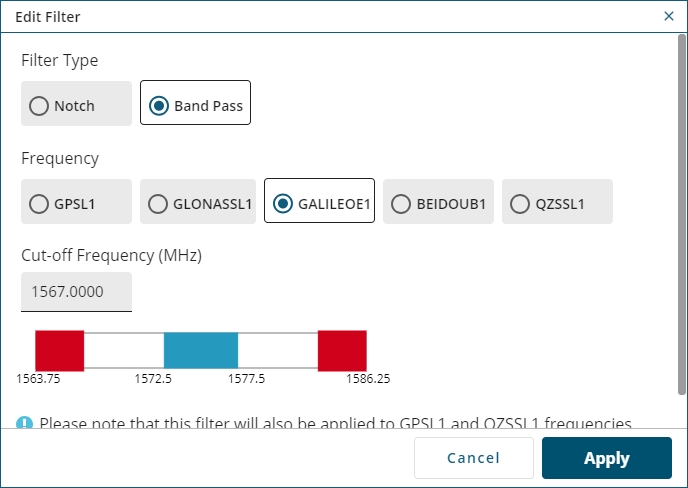
Enter the cut-off frequency for the filter in the Cut-off Frequency text box.
-
The frequency selected must be in the range shown on the frequency bar. For the example shown above, the value must be between 1563.75 and 1586.25 MHz.
-
The selected frequency can not be within the central frequencies, represented by the blue bar. In this example, the frequency cannot be between 1572.5 and 1577.5 MHz.
-
Two band pass filters are added which are equal distance from the center frequency. The configured filter is represent by red bars at the upper and lower end of the frequency bar.
-
-
Click the Add button.
A box for the new filter is added to the Settings menu, a new button for the filter is added to the Interference Toolkit window and the filtered signal is displayed on the ITK Spectrum plot.
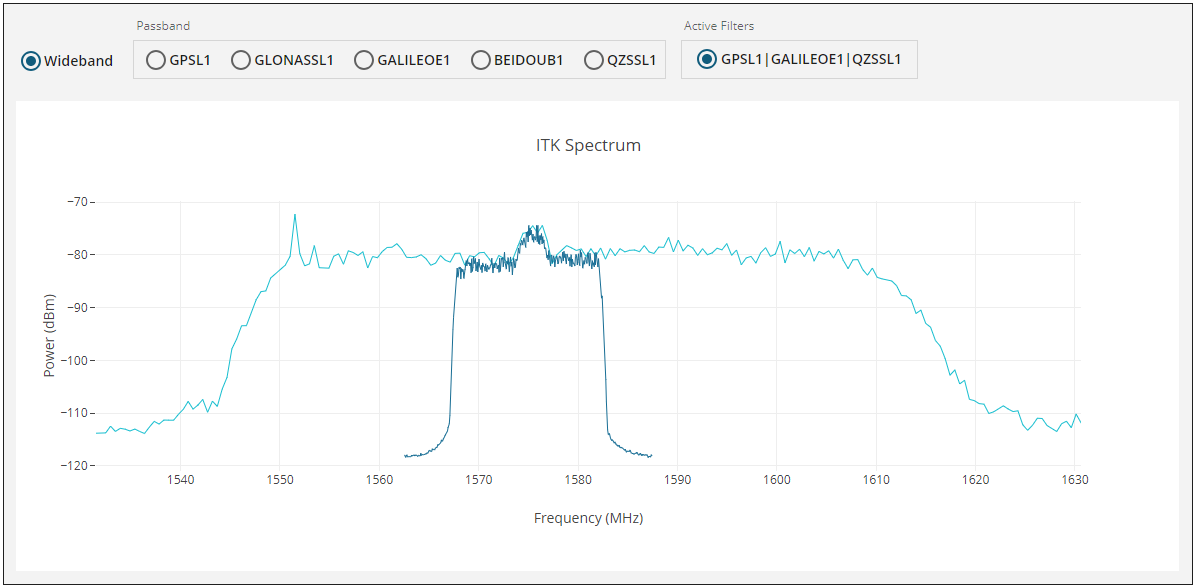
When the filter button is selected, the filtered signal is updated.
When the filter button is not selected, the unfiltered signal is updated.
Activate/Deactivate a Filter
When a filter is activated, the filter is applied to the incoming signal. To activate a filter:
-
Click the Settings menu.
-
Set the Active button to on
)The filtered signal and a button for the filter appear on the Interference Toolkit window.
When a filter is deactivated, the filter is not applied to the incoming signal. To deactivate a filter:
-
Click the Settings menu.
-
Set the Active button to off
)The filtered signal and the button for the filter are removed from the Interference Toolkit window.
Edit a Filter
To edit a filter:
-
Click the Settings menu.
-
Click the menu button
 )
)The Edit Filter dialog box appears.
-
Change the filter parameters to the desired settings.
-
Click the Apply button.
Delete a Filter
To delete a filter:
-
Click the Settings menu.
-
Click the menu button
)
Advanced Settings
The Advanced Settings configure the parameters used to generate the plot.
Decreasing the Update Rate or increasing the Spectrum Resolution will impact receiver idle time. The idle time should be monitored to prevent adverse effects on receiver performance.
The Advanced Settings are not available when connected to the receiver using a serial connection.
Update Rate (Secs)
This parameter sets the spectrum update rate in seconds. It determines how quickly the plot is updated.
The update interval is limited by the FFT size chosen. For 32k, the minimum update period is 0.1 seconds and for 64k, the minimum update period is 0.2 seconds.
Spectrum Resolution (K)
This parameter sets the frequency resolution of the spectrum.
Time Averaging (Secs)
This parameter sets the time averaging window in seconds. 0 means no time averaging.
Detection Sensitivity (Bins)
This parameter sets the integration window size of FFT samples. 1 means no integration.
To reset the Advanced Settings to the default values, click the Restore Settings Defaults button.