Spectrum Viewer
The Spectrum Viewer window shows the Radio Frequency (RF) spectrum in a range of frequencies around the GNSS signals that are being received by the OEM7 receiver. The Spectrum Viewer can be displayed in Spectrum view or Waterfall view.
Spectrum view
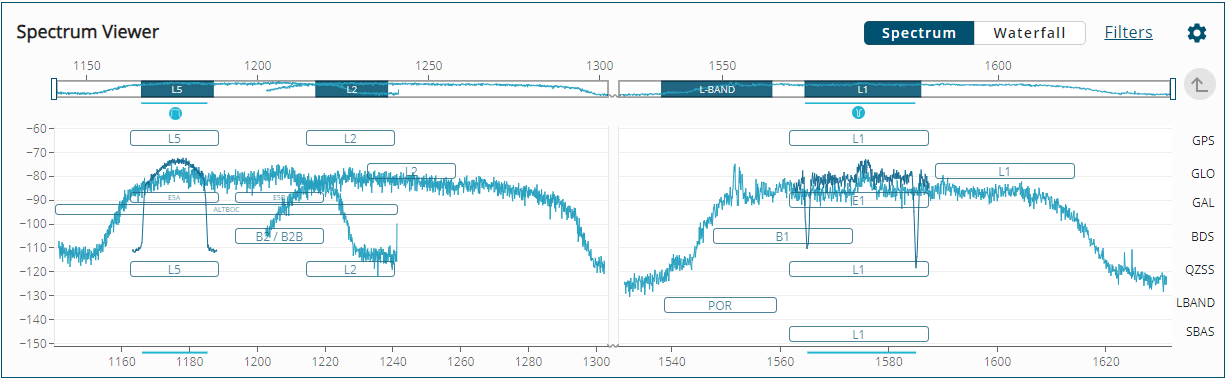
In Spectrum view, the Spectrum Viewer window shows the real-time received GNSS signals. To show the Spectrum view (default), click the Spectrum button.
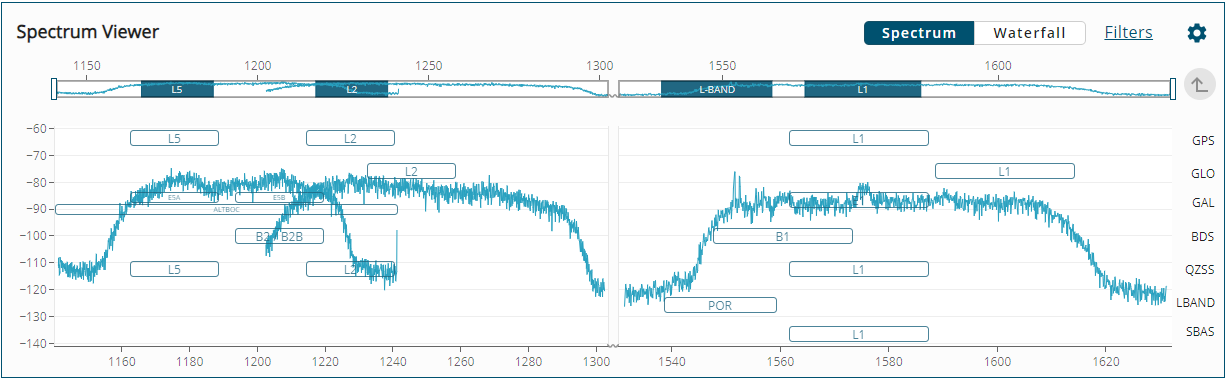
The received RF signals are plotted with the received signal strength (left vertical axis) over the signal frequency (bottom axis). These signals overlay boxes representing the signal bands for each GNSS constellation (right vertical axis).
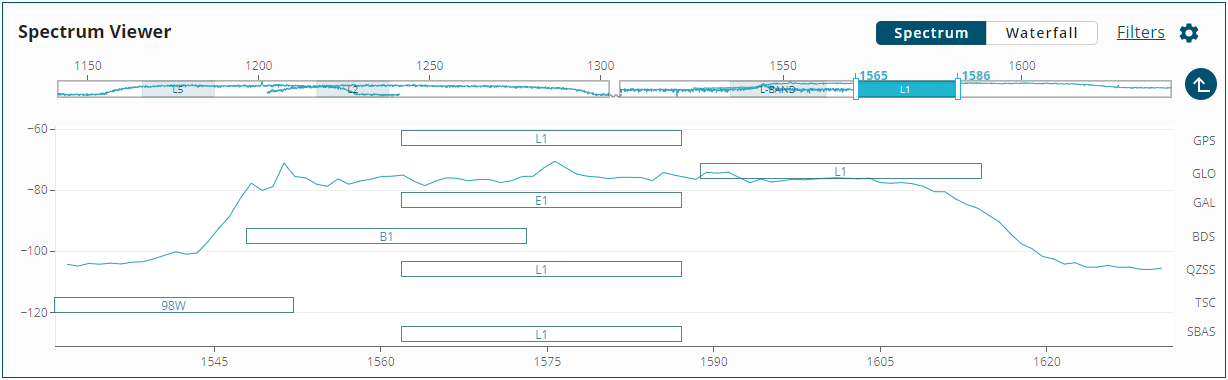
To zoom in on a specific signal band, click the Band box (dark box labelled L5, L2, L1 or L-BAND) on the Overview bar.
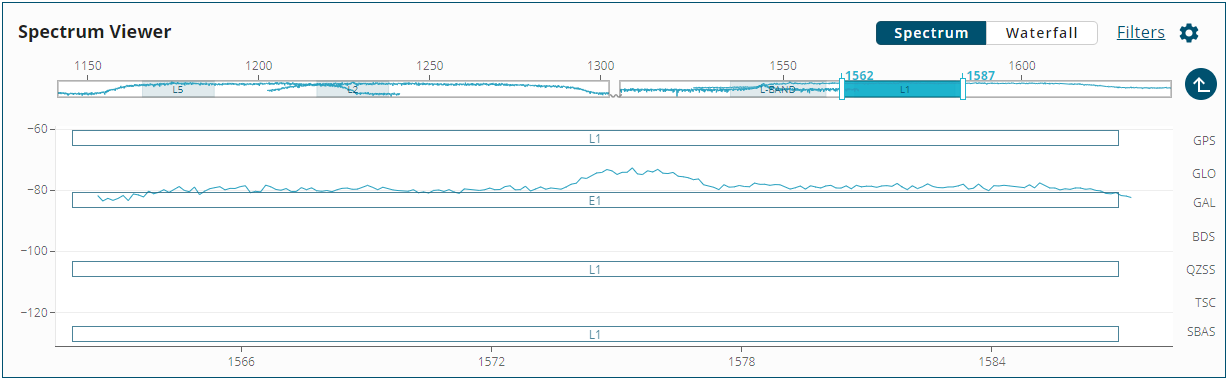
To zoom in on a specific signal, click the Signal box (white box) on the RF signal plot.
To return to viewing all signals and bands, click the Up button )
)
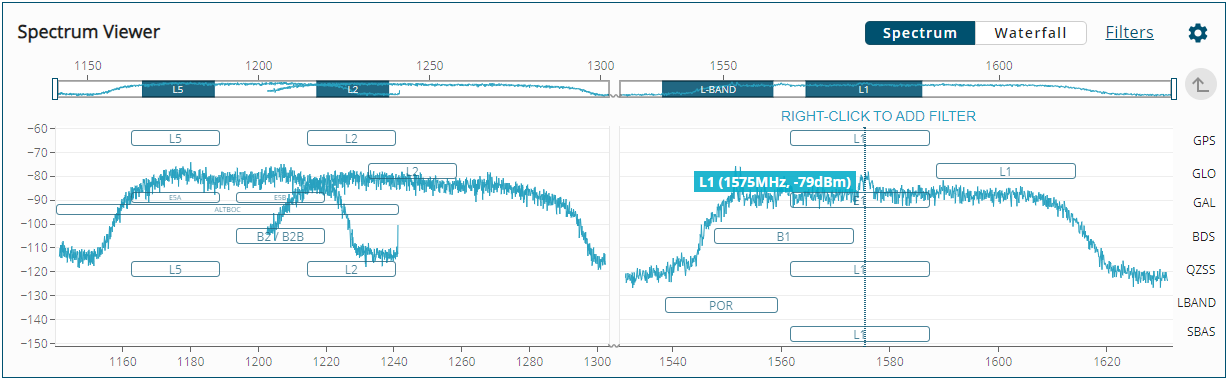
To view details about a specific frequency, hover the mouse pointer over the received signal plot. The band, frequency and signal strength are shown.
Waterfall view
In Waterfall view, the Spectrum Viewer window shows a running history of the received GNSS signals. To show the Waterfall view, click the Waterfall button.
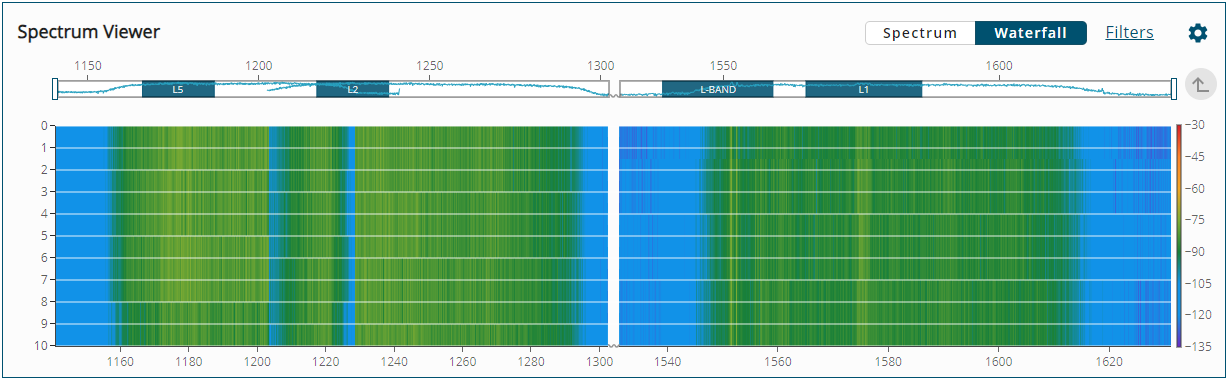
The received RF signals are plotted with time (left vertical axis) over the signal frequency (bottom axis). The received signal strength (right vertical axis) is represented by the colour of the frequency at a specific time.
To zoom in on a specific signal band, click the Band box (dark box labelled L5, L2, L1 or L-BAND) on the Overview bar.
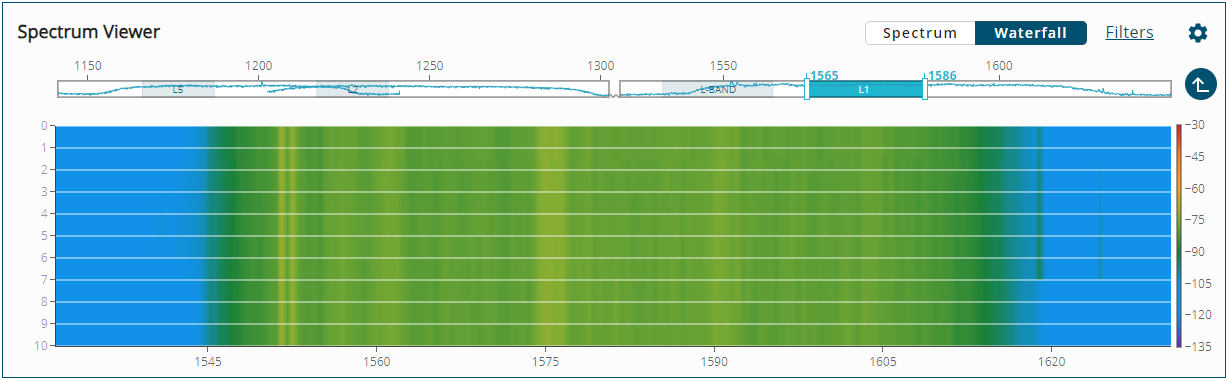
To view details about a specific time and frequency, hover the mouse pointer over the waterfall plot. The band, frequency and signal strength for that time are shown.
Filters
If an interference signal is present, GRIT Monitor can reduce or eliminate the impact on GNSS tracking using the programmable bandpass or notch filters.
Filters can not be applied to the LBand signal band.
Notch filter
A notch filter reduces the signal power in a narrow frequency band. This type of filter is useful for reducing the signal power of a single, narrow band interference signal. Note that the narrowest possible filter should be used to maintain the maximum amount of overall signal power.
To add a notch filter:
-
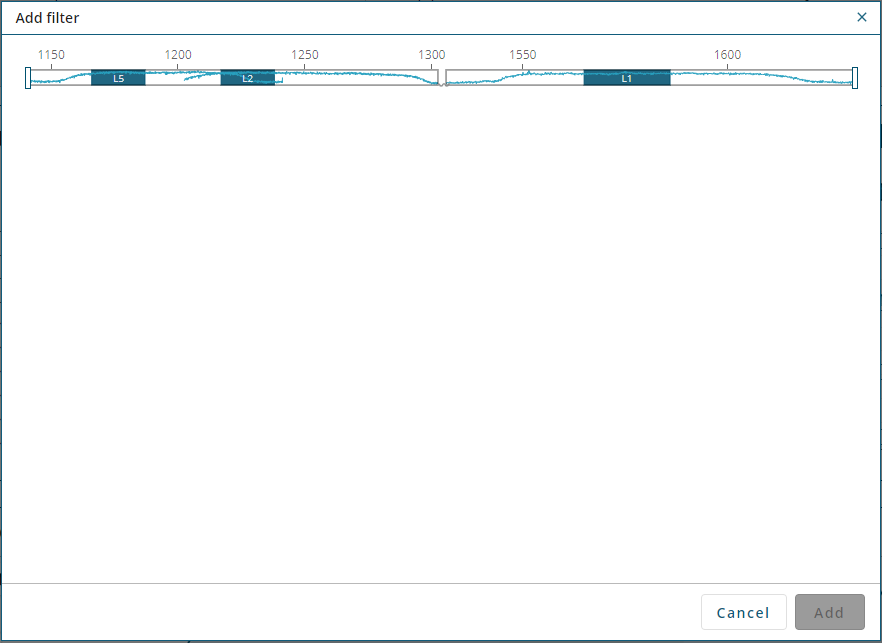
Click Filters and then click Add filter.
The Add filter dialog box appears.
A filter can also be added using one of the following:
-
Move the mouse pointer over the frequency on the Spectrum Viewer signal plot and click the right mouse button. The Add filter dialog box appears with the information required for a filter for the selected frequency entered.
-
Click the Add filter link in the interference message on the Mitigation Assistant window.
-
Click the Add filter link in the interference tooltip on the Position Overview window.
-
-
Click the button for the band to which the filter will be added.
The Add filter dialog box changes to show the signals available in the selected band.
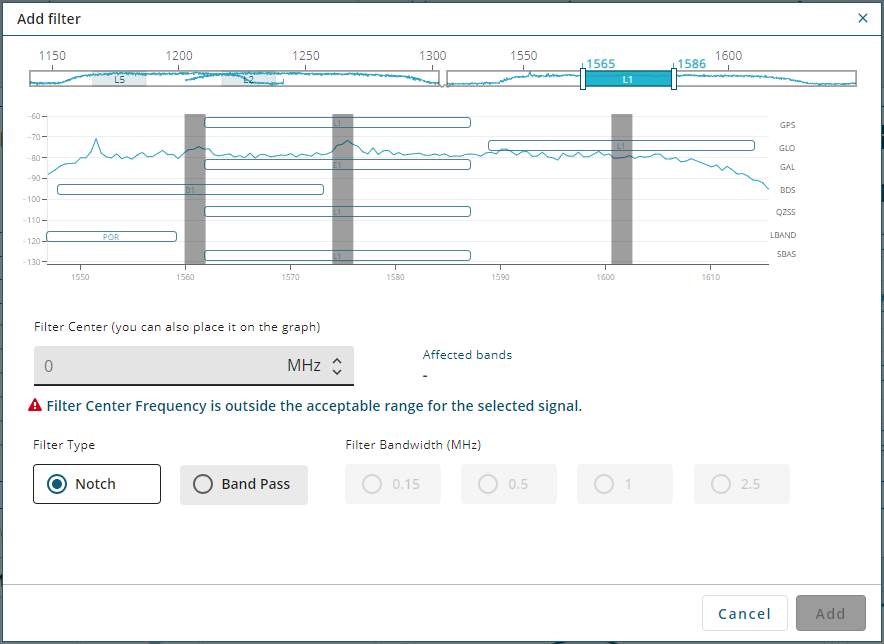
-
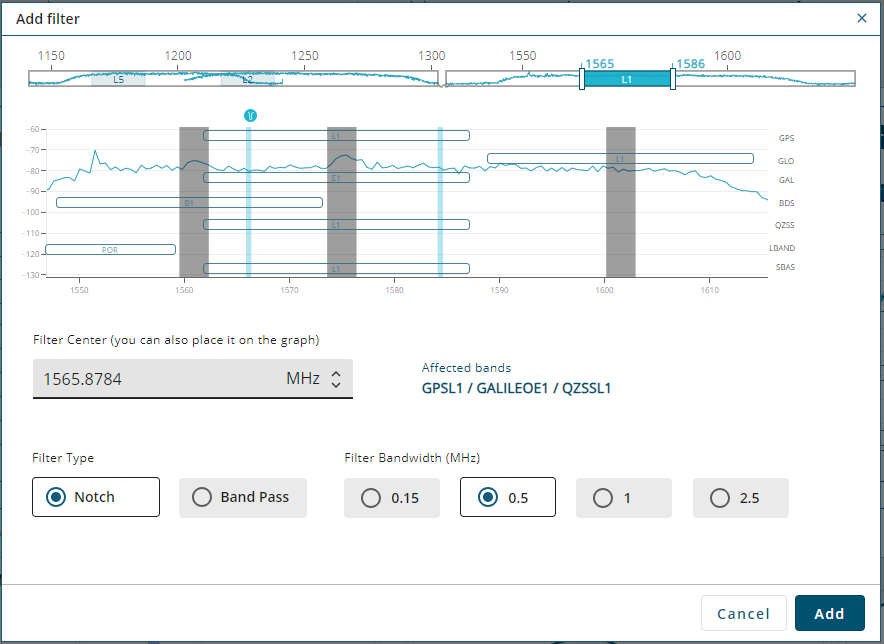
Use the mouse to select the centre frequency of the filter on the signal display. The selected frequency appears in the Filter Center box
Alternately, the centre frequency for the filter can be entered in the Filter Center box.
The GNSS signals impacted by the filter are shown in the Affected bands box.
The centre frequency entered or selected can be adjusted using the up and down arrows in the Filter Center box.
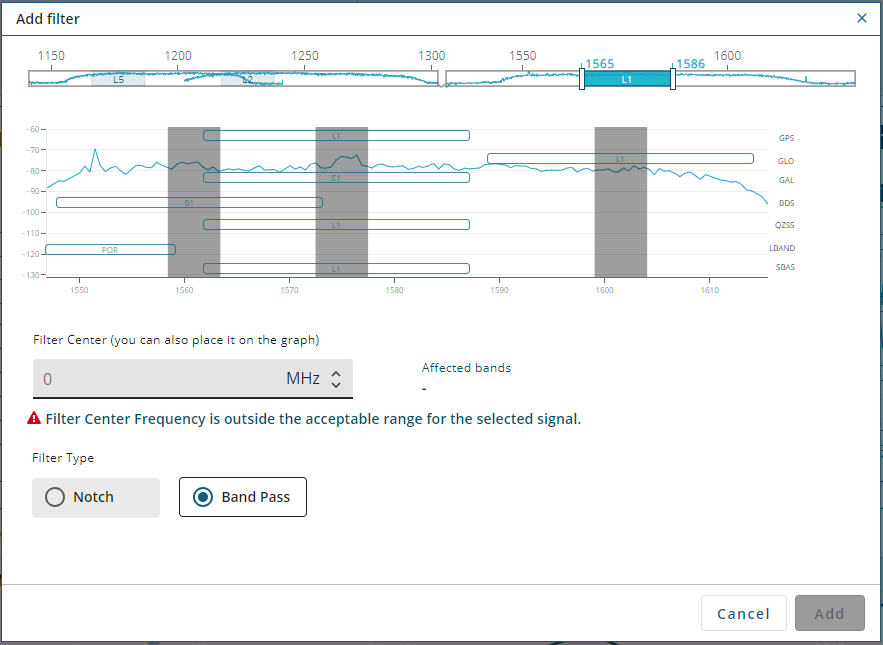
GRIT Monitor provides an error message if the centre frequency entered or selected is not within the allowable range.
-
Select the Filter Bandwidth option for the notch filter. Only options valid with the entered centre frequency are available.
-
Select the narrowest bandwidth that will remove the interference signal.
-
Two notch filters are added which are equal distance from the centre frequency. The configured filters are represented by blue bars on the signal display.
-
-
Click the Add button.
The Spectrum Viewer window appears with the notch filtered plot shown.
Bandpass filter
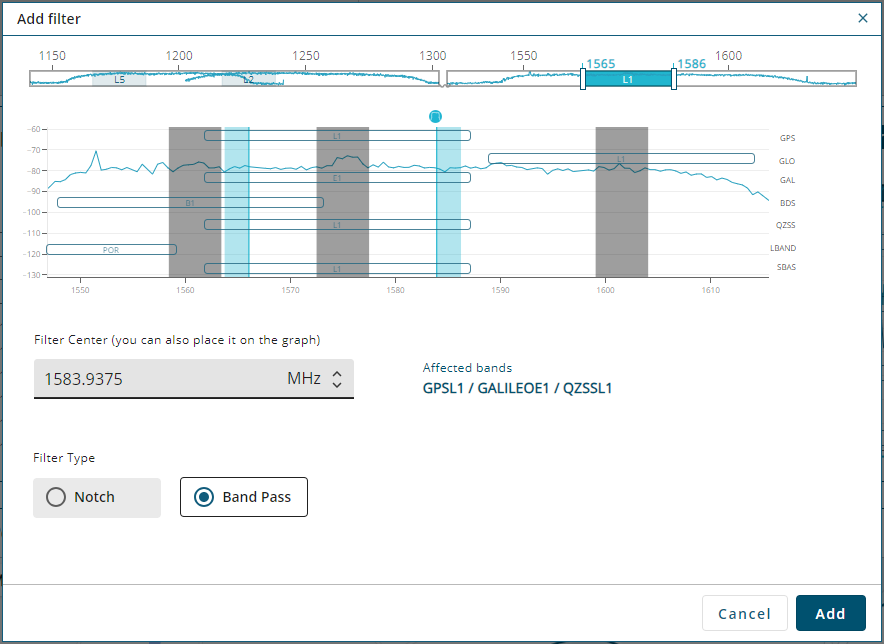
A bandpass filter reduces the signal power of all incoming signals at the upper and lower end of the GNSS signal band starting at the configured cut-off frequency. This type of filter is good for reducing single or multiple interference signals at the edges of the signal band.
When a bandpass filter is applied to the signal, the upper and lower ends of the signal band are filtered out to reduce the signal power of the interference signal.
To add a bandpass filter:
-
Click Filters and then click Add filter.
Alternately, move the mouse pointer over the Spectrum Viewer signal plot and click Add filter.The Add filter dialog box appears.
A filter can also be added using one of the following:
-
Move the mouse pointer over the frequency on the Spectrum Viewer signal plot and click the right mouse button. The Add filter dialog box appears with the information required for a filter for the selected frequency entered.
-
Click the Add filter link in the interference message on the Mitigation Assistant window.
-
Click the Add filter link in the interference tooltip on the Position Overview window.
-
-
Click the button for the band to which the filter will be added.
The Add filter dialog box changes to show the Signals available in the selected band.
-
Click the Band Pass option.
-
Use the mouse to select the centre frequency of the filter on the signal display. The selected frequency appears in the Filter Center box.
Alternately, the centre frequency for the filter can be entered in the Filter Center box.
The GNSS signals impacted by the filter are shown in the Affected bands box.
The centre frequency entered or selected can be adjusted using the up and down arrows in the Filter Center box.
GRIT Monitor provides an error message if the centre frequency entered or selected is not within the allowable range.
Two band pass filters are added which are equal distance from the centre frequency. The configured filters are represented by blue bars on the signal display.
-
Click the Add button.
The Spectrum Viewer window appears with the band pass filtered plot shown.
When a filter is added, the frequency response of the filtered signal is shown on the Spectrum Viewer window.
An icon below the overview bar indicates the type of filter applied for bandpass filters and
  for notch filters)
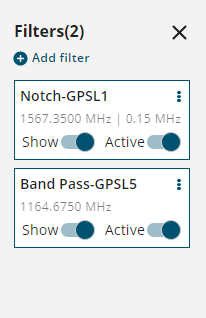
Show/Hide a Filter
The configured filters can be shown or hidden from the Spectrum Viewer window. To show or hide a filter:
-
Click the Filters link.
The Filters dialog appears.
-
To show a filter on the Spectrum Viewer window, set the Show button to on
 )
)To hide a filter on the Spectrum Viewer window, set the Show button to off
 )
)Hidden filters continue to filter the signal even though they are not visible on the Spectrum Viewer window.
Activate/Deactivate a filter
When a filter is activated, the filter is applied to the incoming signal.
-
Click the Filters link.
The Filters dialog appears.
-
To activate a filter, set the Active button to on
)To deactivate a filter, set the Active button to off
)
Edit a filter
To edit a filter:
-
Click the Filters link.
The Filters dialog appears.
-
Click the menu button
 )
)The Edit Filter dialog box appears.
-
Change the filter parameters to the desired settings.
For notch filters, only the Filter Center and Filter Bandwidth parameters can be changed.
For band pass filters, only the Filter Center parameter can be changed.
-
Click the Apply button.
Delete a filter
To delete a filter:
-
Click the Filters link.
The Filters dialog appears.
-
Click the menu button
)
Advanced Settings
The Advanced Settings configure the parameters used to generate the plot. To access the Advanced Settings, click the Settings icon )
)
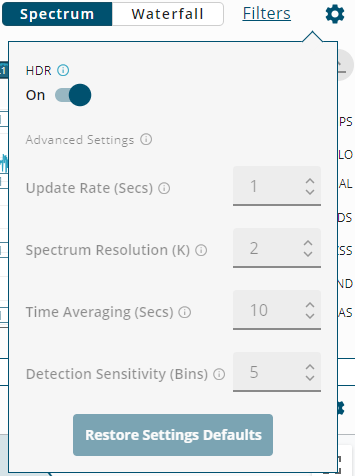
Decreasing the Update Rate or increasing the Spectrum Resolution will impact receiver idle time. The idle time should be monitored to prevent adverse effects on receiver performance.
The Advanced Settings are not available when connected to the receiver using a serial connection.
The Advanced Settings are only available when the Spectrum Viewer has been zoomed in to a signal band (e.g. L1, L5, etc.) or a single signal (GPS L1, Galileo E5a, etc.).
HDR
The High Dynamic Range (HDR) mode enables special signal processing to remove distortions from the spectrum, providing a cleaner signal. This optimises the Automatic Gain Control (AGC) to prevent interfering signals from drowning out the GNSS signals. HDR mode works well against wide band and out-of-band interferers. HDR mode can be combined with bandpass and notch filters, but does draw more power.
Update Rate (Secs)
This parameter sets the spectrum update rate in seconds. It determines how quickly the plot is updated.
The update interval is limited by the FFT size chosen. For 32k, the minimum update period is 0.1 seconds and for 64k, the minimum update period is 0.2 seconds.
Spectrum Resolution (K)
This parameter sets the frequency resolution of the spectrum.
Time Averaging (Secs)
This parameter sets the time averaging window in seconds. 0 means no time averaging.
Detection Sensitivity (Bins)
This parameter sets the integration window size of FFT samples. 1 means no integration.
To reset the Advanced Settings to the factory default values, click the Restore Settings Defaults button.