Interference Toolkit
The Interference Toolkit (ITK) monitors, quantifies and mitigates interference sources to prevent interference from impacting receiver performance.
Use the Interference Toolkit to monitor the Radio Frequency (RF) spectrum in a range of frequencies around the GNSS signals that are being received by the OEM7 receiver. By plotting the information obtained, it can be determined if there is an interference signal within the GNSS signal band.
Auto-detect functionality applies to in-band interference only. It does not detect out-of-band interference.
On the Interference Toolkit tile, click on a frequency band tab to view the interference status of the different signals.
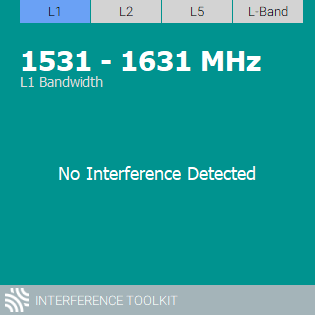
The tile displays:
-
Green: When there is no interference for the selected GNSS frequency band
-
Red: If any one signal frequency has interference
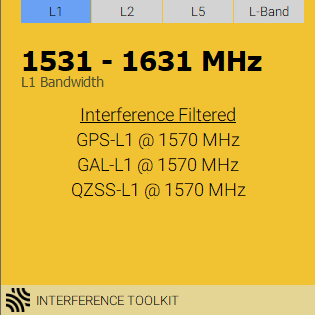
-
Yellow: If interference has been filtered
Click  to open the Interference Toolkit full size tile.
Double click the tile, or click  , to open the Interference Toolkit window.
The Interference Toolkit window and full size tile are synchronised. Changes to settings and signals viewed on the window are also made on the full size tile and vice versa.
Changing the signals displayed
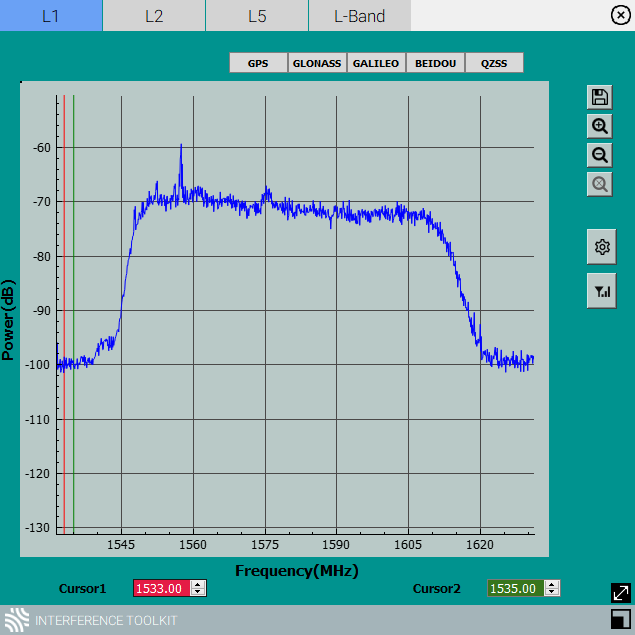
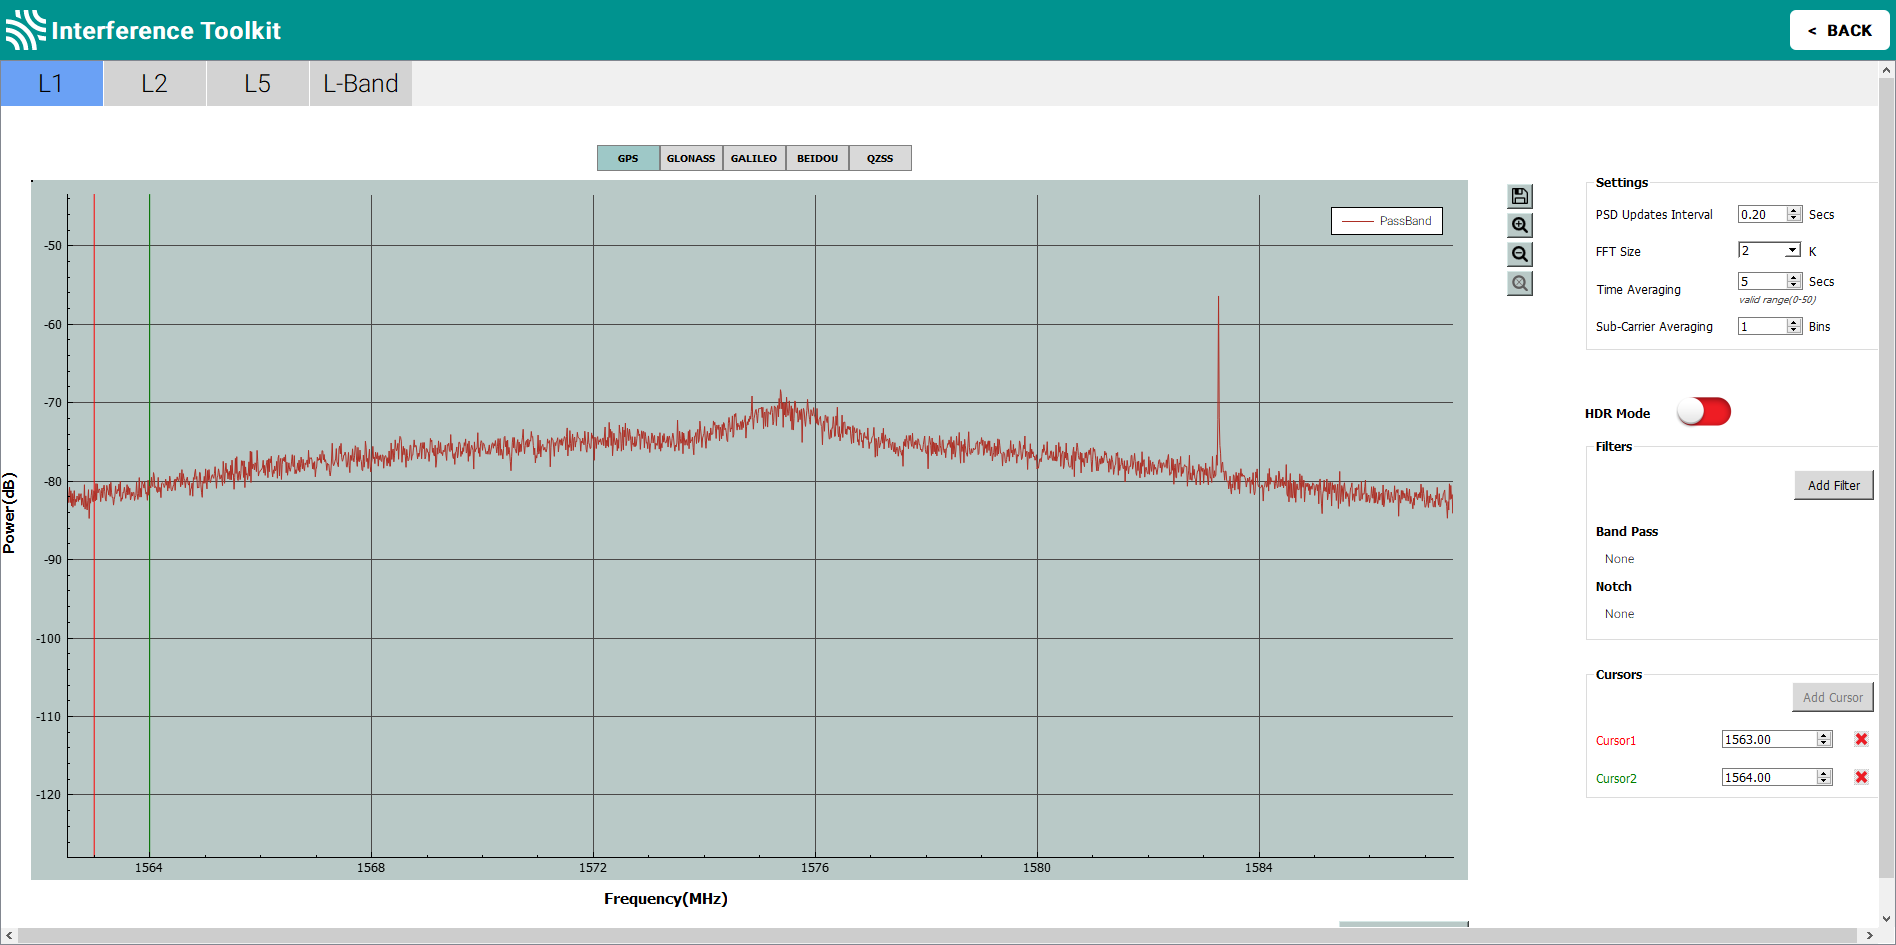
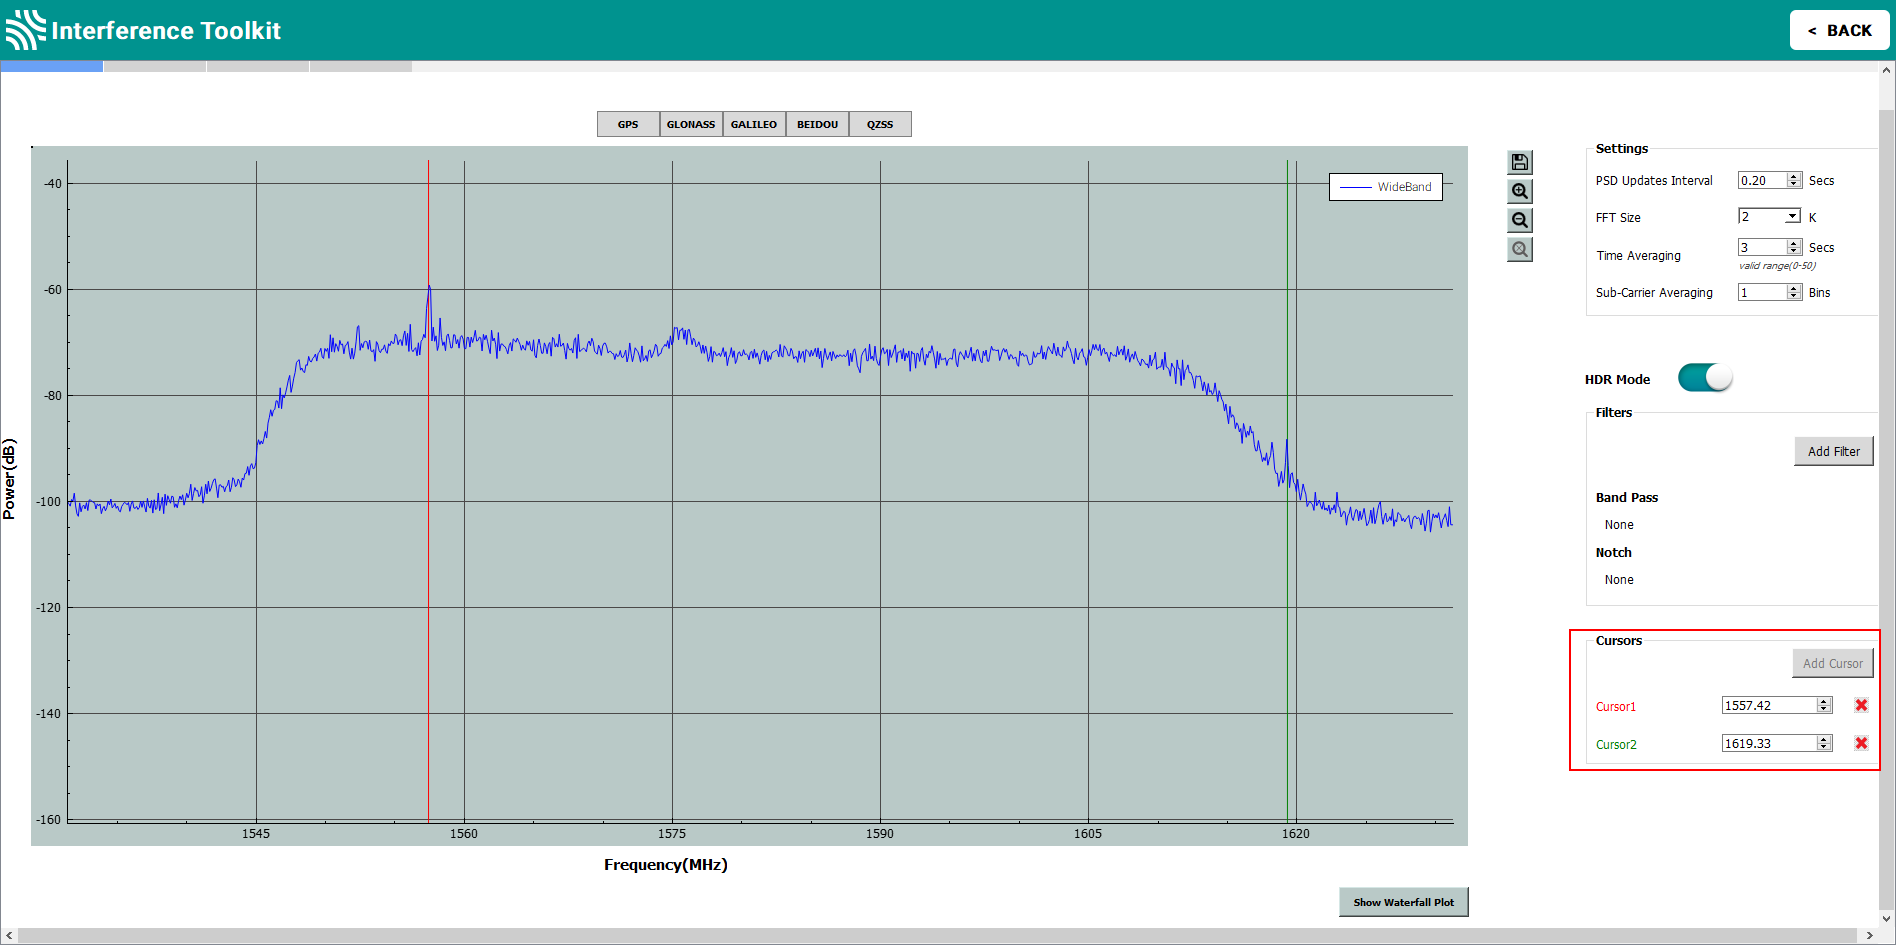
When first opened, the Interference Toolkit displays the wide band plot for the L1 frequency band. To view other wide band plots, click one of the frequency band tabs (e.g. L2) at the top of the window.
To view the pass band for a constellation, click the button for that constellation (e.g. GPS). The button for the constellation is highlighted to indicate the pass band being viewed.
To return to the wide band plot, click the highlighted constellation button.
The available pass band and wide band plots are:
-
L1 – GPS, GLONASS, Galileo, BeiDou, QZSS
-
L2 – GPS, GLONASS, BeiDou, QZSS
-
L5 – GPS, Galileo, QZSS
-
L-Band – LBAND
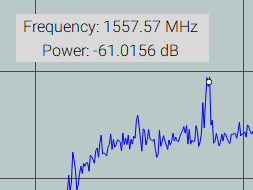
Hover over any point on a signal to display the frequency and power for that specific location in the signal.
Zoom in and out
Use the buttons on the right side of the signal plot to zoom the display in and out.
|
|
Click to zoom in on the signal plot. |
|
|
Click to zoom out. |
|
|
Click to return to the default zoom level. |


To zoom in on a specific portion of the signal plot, click and drag to highlight a portion of the signal. When the mouse button is released, the zoom level changes to show the portion of the signal highlighted.
Click  to return to the default zoom level.
Saving a signal plot
To save a copy of the signal plot image currently being viewed, including zoom level, click the  button.
The saved signal plot can be viewed using any graphic viewing or editing software.
Display cursors
The signal plot has two vertical cursors. One is green and the other is red. These cursors are used to identify the frequency of a location on the signal plot. The current location of the cursors are shown in the text boxes in Cursors box.
To identify the frequency of a location on the plot, move the cursor to the location. The frequency of the location, in MHz, is shown in the text box for that cursor. Move the cursor by clicking the cursor and dragging it to the location of interest or use the up and down next to the text box. If a value is entered into the text box, the cursor will move to that location.
The cursors can be removed from the display by clicking the red X next to the cursor text box. If a cursor has been removed, it can be added back by clicking the Add Cursor button.
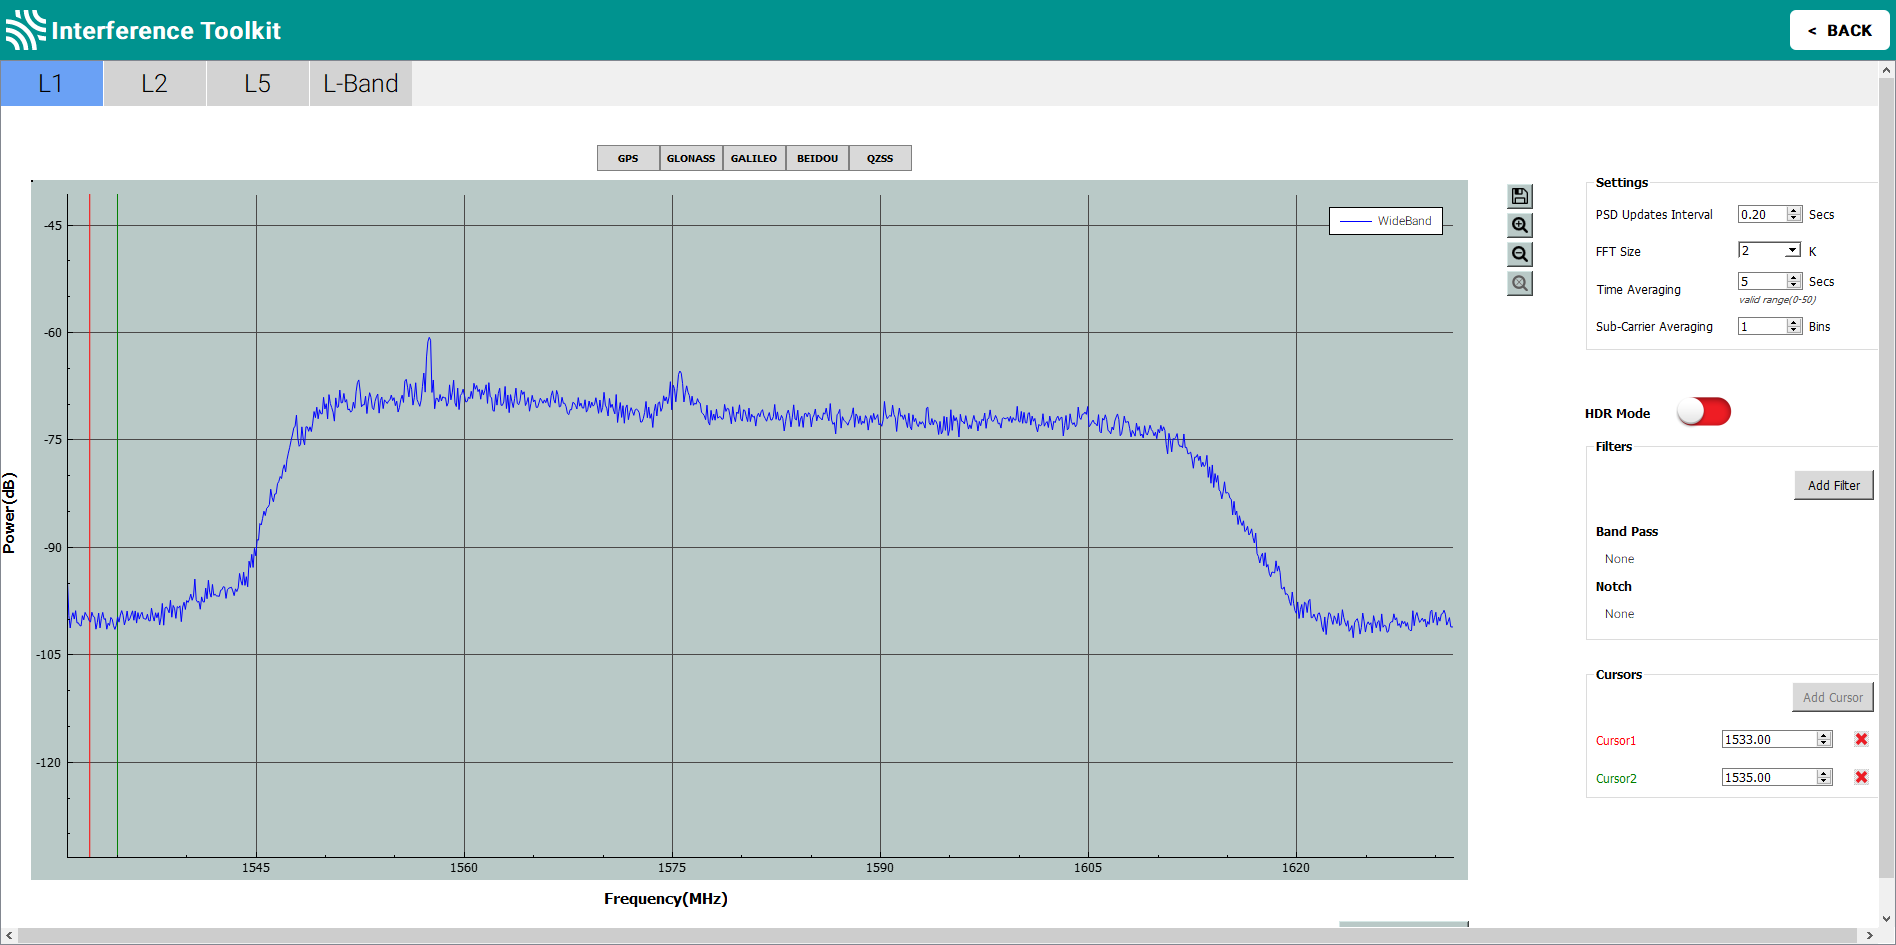
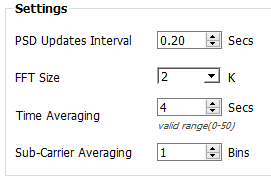
Settings
The parameters in the Settings panel configure the spectral analysis used to generate the signal plot.
|
PSD Updates Interval |
The spectrum update rate. |
|
FFT Size |
The frequency resolution of the spectrum. |
|
Time Averaging |
Time averaging window. |
|
Sub-Carrier Averaging |
Sliding window average over a number of FFT samples. |
Refer to the ITSPECTRALANALYSIS command for more information about these parameters.
If the update rate settings of the plot are set too high, the receiver or Connect may become unresponsive.
Waterfall plot
Click the Show Waterfall Plot button to display the waterfall plot for the current signal plot.
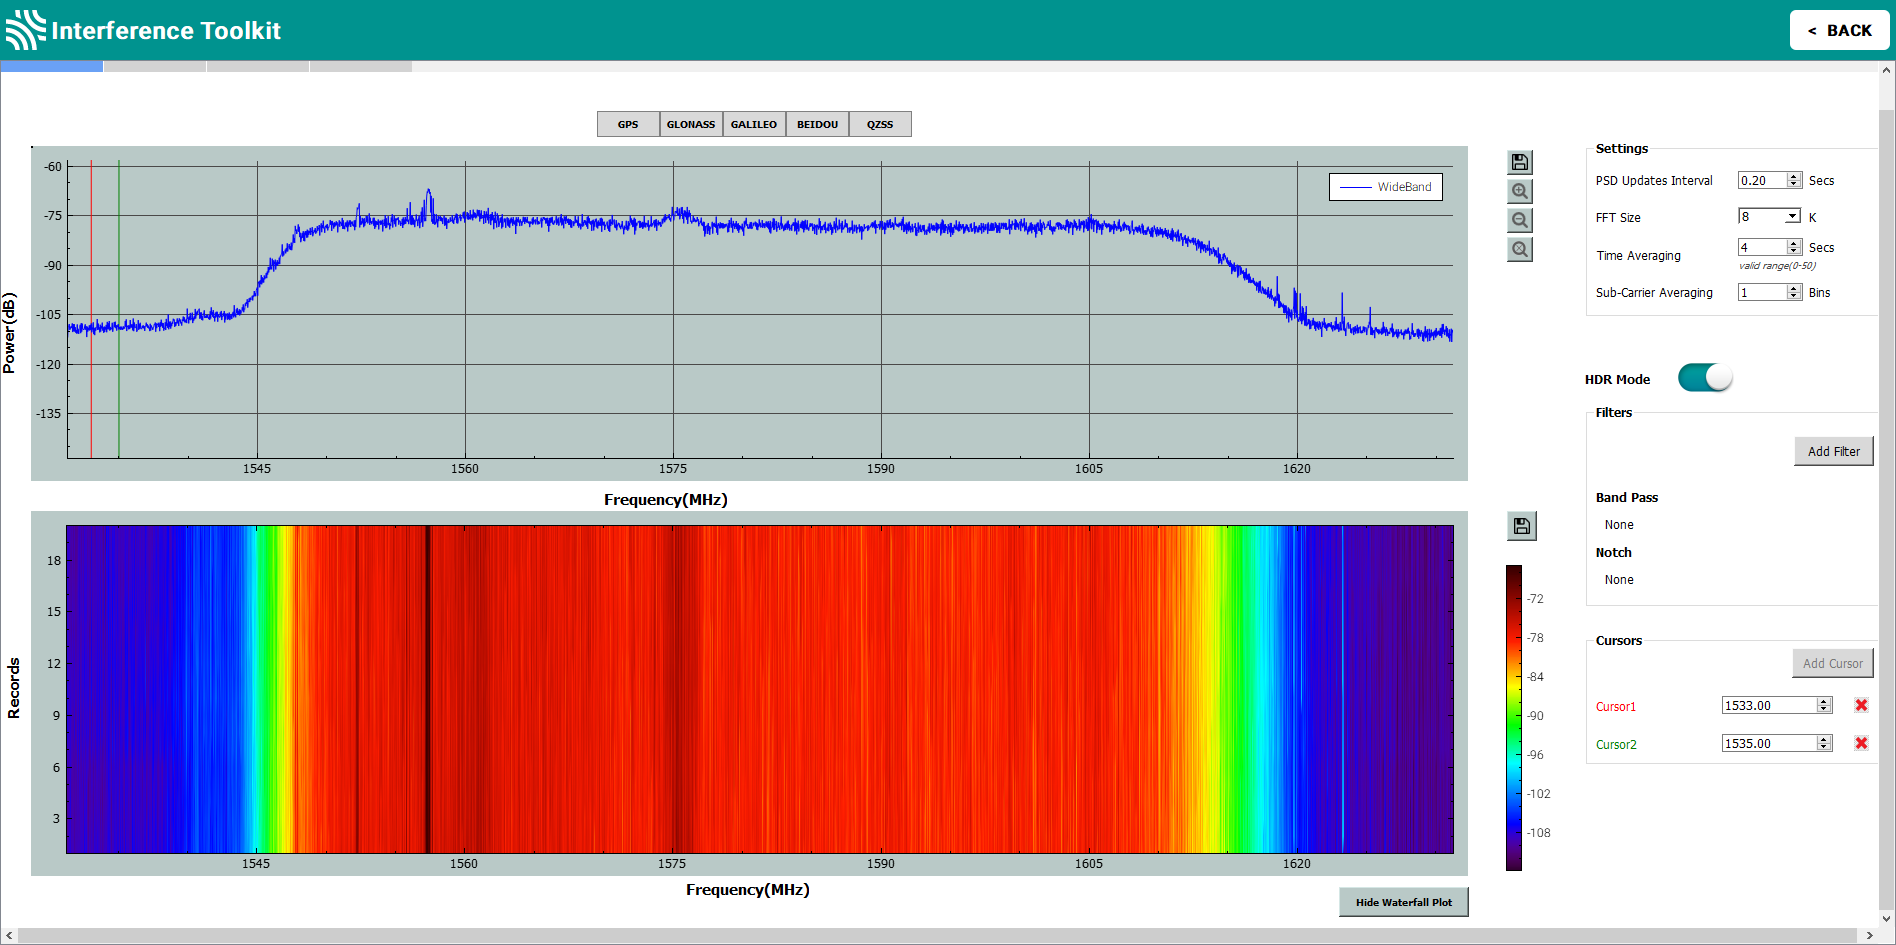
The waterfall plot shows a brief history of the signal plot. Hover the mouse pointer over any spot on the waterfall plot to display the frequency and power for that spot.
Remove interference signals
If an interference signal is present, the Interference Toolkit can reduce or eliminate the impact on GNSS tracking using the programmable High Dynamic Range (HDR), band pass filters or notch filters.
The feature to remove interference signals is model controlled. Contact NovAtel Sales (novatel.com/contactus/sales-offices) to obtain full mitigation functionality.
High Dynamic Range (HDR) mode
The High Dynamic Range (HDR) mode enables special signal processing to remove distortions from the spectrum, providing a cleaner signal. This optimises the Automatic Gain Control (AGC) to prevent interfering signals from drowning out the GNSS signals. HDR mode works well against wide band and out-of-band interferers. HDR mode can be combined with bandpass and notch filters but does draw more power.
Simply slide the HDR slide right or left to adjust.
|
|
HDR mode off |
|
|
HDR mode on |
Band pass filter
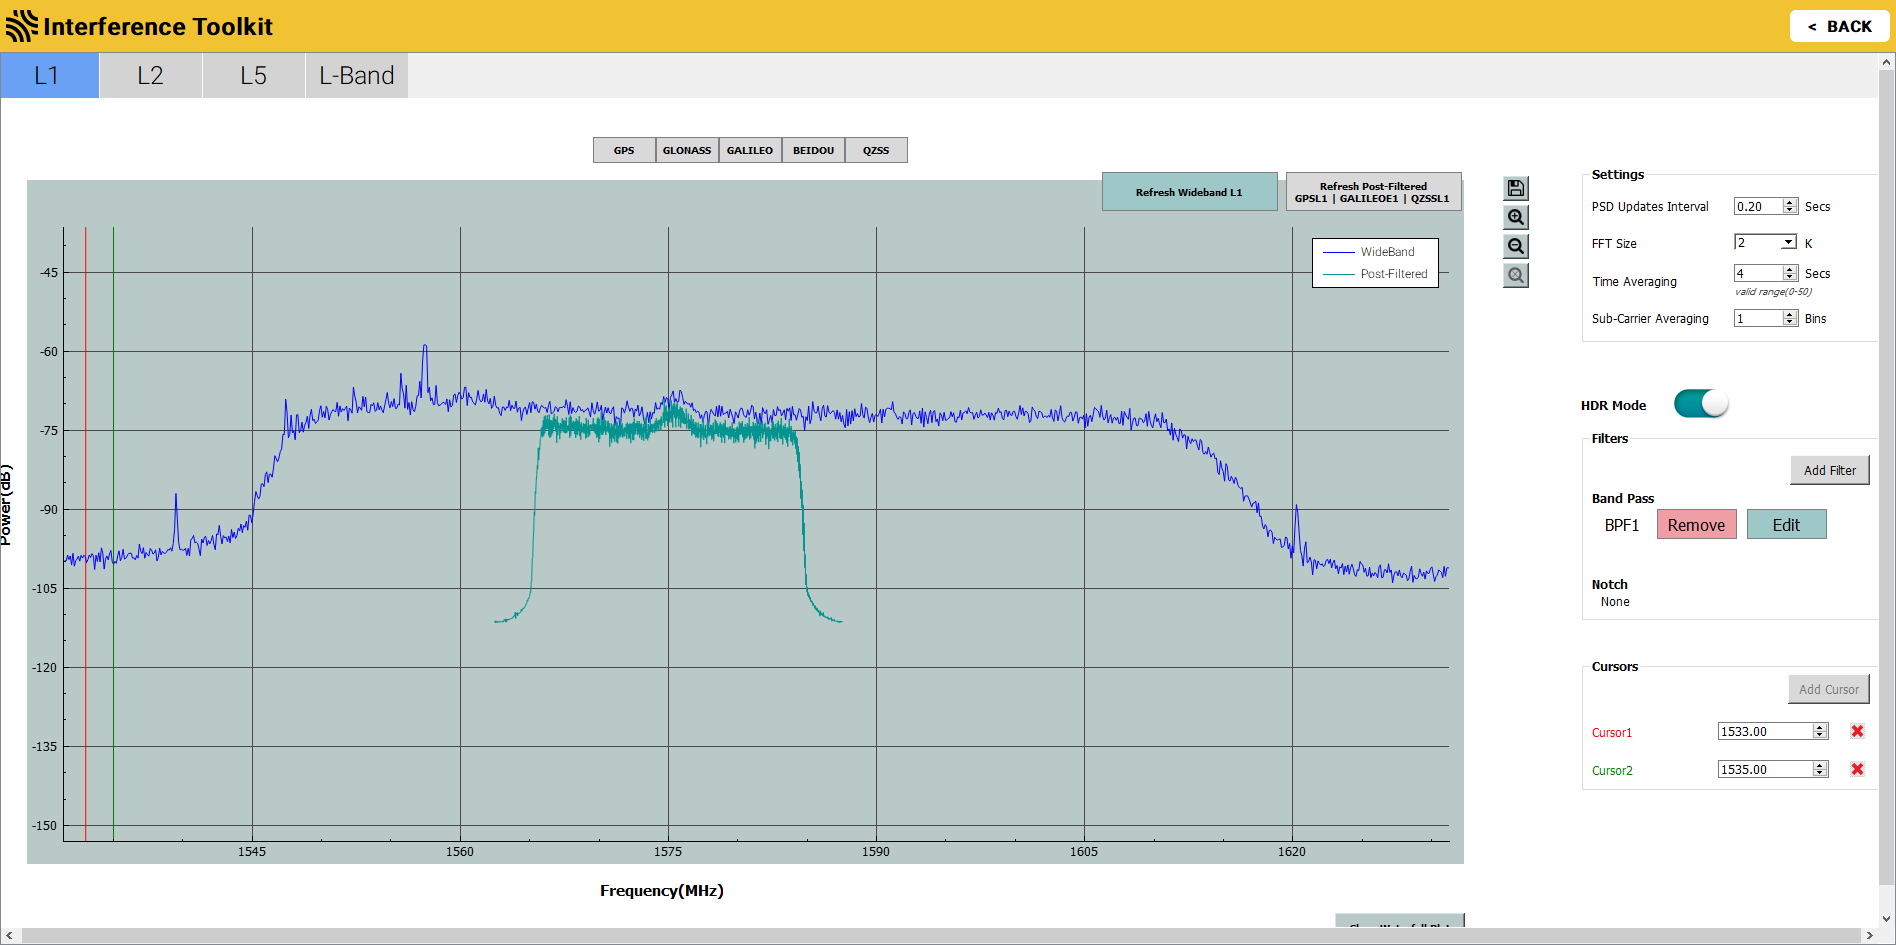
The Interference Toolkit band pass filter reduces the signal power of all incoming signals at the upper and lower end of the GNSS signal band starting at the requested cut-off frequency. This type of filter is good for reducing single or multiple interference signals at the edges of the signal band.
When a band pass filter is applied to this signal, the upper and lower ends of the signal band are filtered out to reduce the signal power of the interference signal.
To configure a band pass filter:
-
Click the tab of the frequency band (L1, L2, L5 or L-Band) that requires a filter.
-
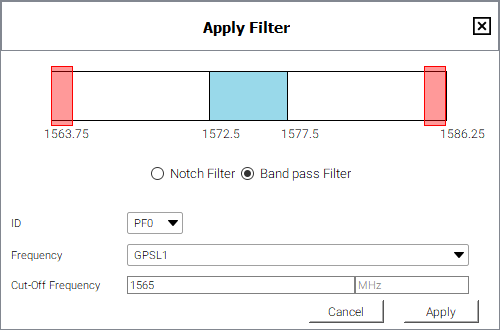
Click the Add filter button. The Apply Filter window appears.
-
Click the Band pass Filter option.
-
Click the ID drop menu and select an ID for this filter.
-
Click the Frequency drop menu and select the GNSS signal to which the filter will be applied.
The frequency bar at the top of the Apply Filter window changes to the show the frequency range of the selected signal.
-
Enter the cut-off frequency for the filter in the Cut-Off Frequency text box.
-
The frequency selected must be in the range shown on the frequency bar. For the example shown above, the value must be between 1563.75 and 1586.25 MHz.
-
The selected frequency can not be within the central frequencies, represented by the blue bar. In this example, the frequency cannot be between 1572.5 and 1577.5 MHz.
-
Two band pass filters are added which are equal distance from the centre frequency. The configured filter is represent by red bars at the upper and lower end of the frequency band.
-
-
Click the Apply button. The Interference Toolkit window appears with the post filtered signal shown on top of signal plot.
The post filtered signal can also be viewed on the Passband signal plot by clicking the one of the constellation buttons. Note that when viewing the passband signal plot, the post filtered signal will only be shown if the filtered signal falls within the passband selected.
The Interference Toolkit updates either the post-filtered signal or the wideband/passband signal, not both. The two buttons at the top right of the signal plot represent the two signals being displayed. The button highlighted in blue is the signal currently being refreshed. To change the signal that is being refreshed, click the button for the signal.
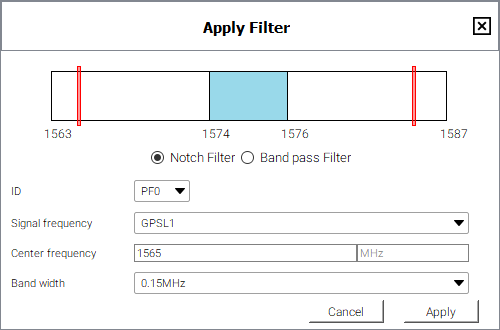
Notch filter
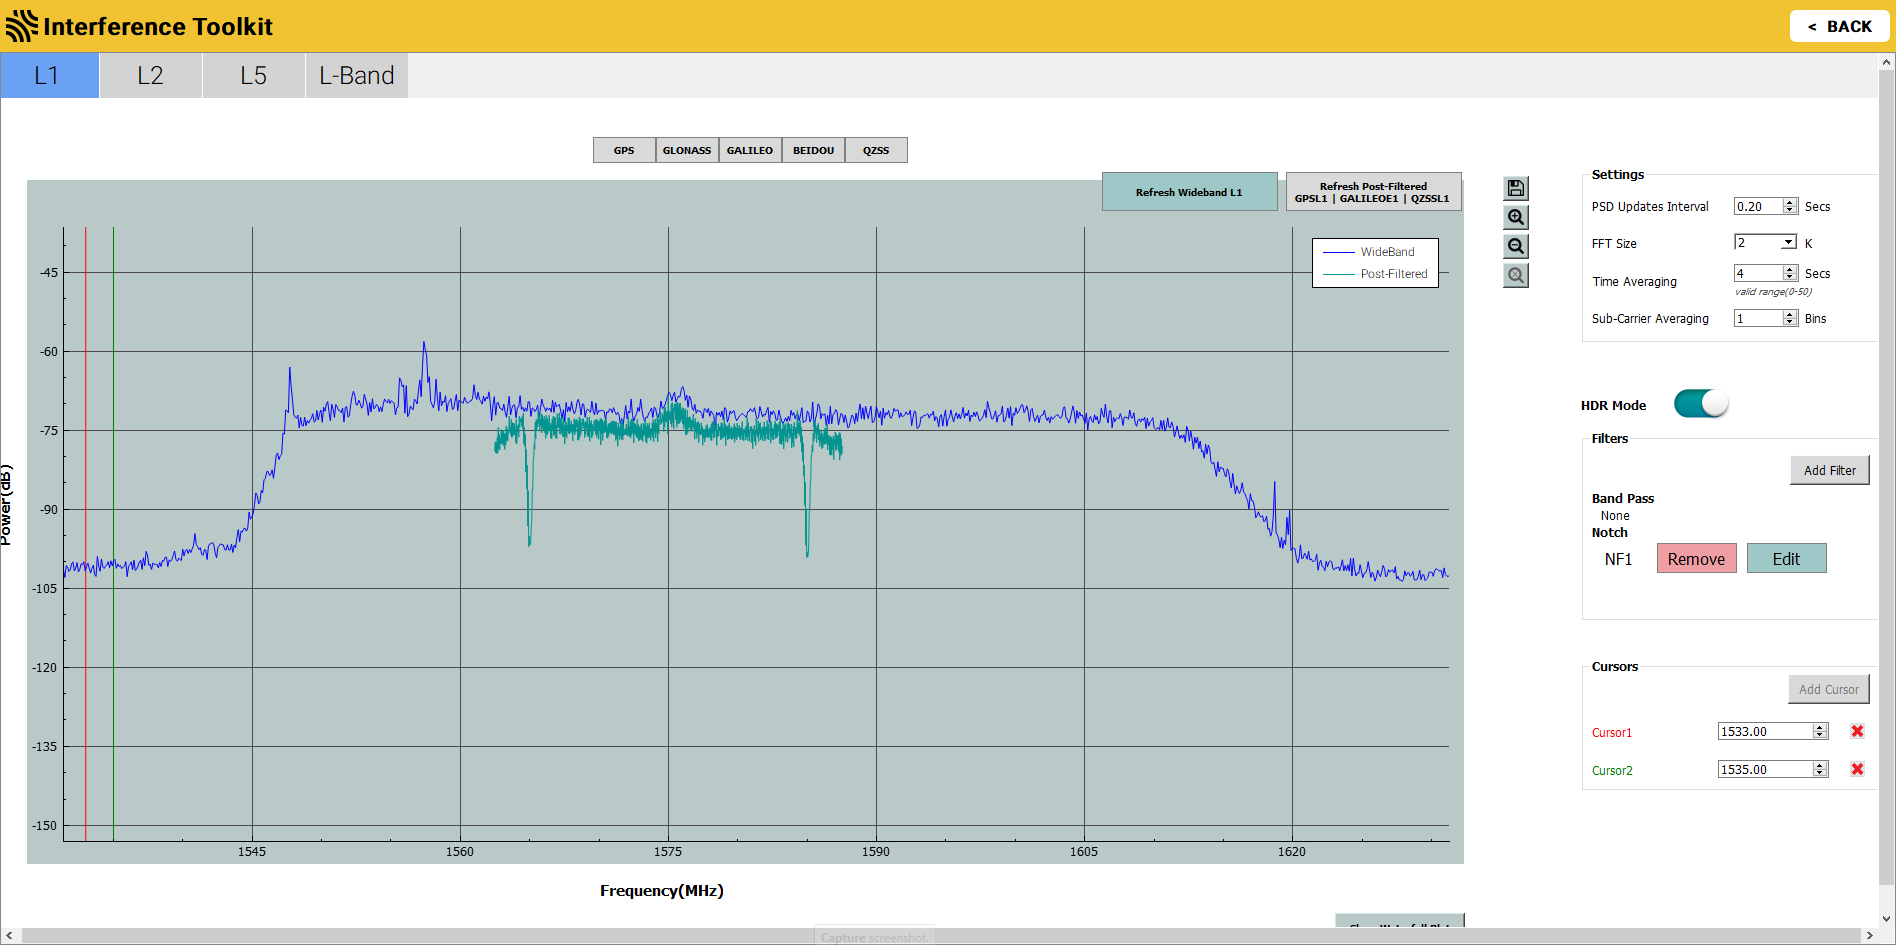
The Interference Toolkit notch filter reduces the signal power in a narrow frequency band. This type of filter is useful for reducing the signal power of a single, narrow band interference signal. Note that the narrowest possible filter should be used to maintain the maximum amount of overall signal power.
To configure a notch filter:
-
Click the tab of the frequency band (L1, L2, L5 or L-Band) that requires a filter.
-
Click the Add filter button. The Apply Filter window appears.
-
Click the ID drop menu and select an ID for this filter.
-
Click the Signal frequency drop menu and select the GNSS signal to which the filter will be applied.
The frequency bar at the top of the Apply Filter window changes to the show the frequency range of the selected signal.
-
Enter the centre frequency for the filter in the Center Frequency text box.
-
The frequency selected must be in the range shown on the frequency bar. For the example shown above, the value must be between 1563 and 1587 MHz.
-
The selected frequency can not be within the central frequencies, represented by the blue bar. In this example, the frequency cannot be between 1574 and 1576 MHz.
-
The configured filter is represent by red bars at the upper and lower end of the frequency band.
-
-
Click the Band width drop menu and select the band width for the notch filter.
-
Select the narrowest band width that will remove the interference signal.
-
Two notch filters are added which are equal distance from the centre frequency. The configured filter is represented by red bars on the frequency band.
-
-
Click the Apply button. The Interference Toolkit window appears with the post filtered signal shown on top of signal plot.
The post filtered signal can also be viewed on the Passband signal plot by clicking the one of the constellation buttons. Note that when viewing the passband signal plot, the post filtered signal will only be shown if the filtered signal falls within the passband selected.
The Interference Toolkit updates either the post-filtered signal or the wideband/passband signal, not both. The two buttons at the top right of the signal plot represent the two signals being displayed. The button highlighted in blue is the signal currently being refreshed. To change the signal that is being refreshed, click the button for the signal.
Edit a filter
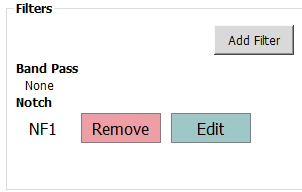
Configured filters are shown in the Filters panel.
To edit filter:
-
Click the Edit button beside the filter to edit. The Apply Notch Filter window appears.
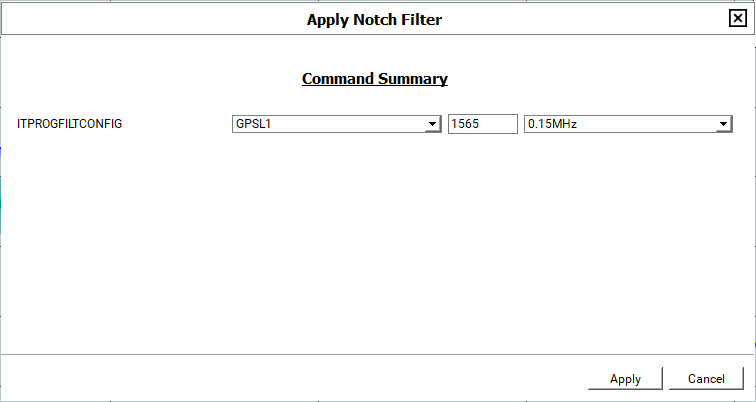
-
Change the filter parameters.
-
Click the Apply button.
Delete a filter
In the Filters panel, click the Remove button beside the filter to delete.